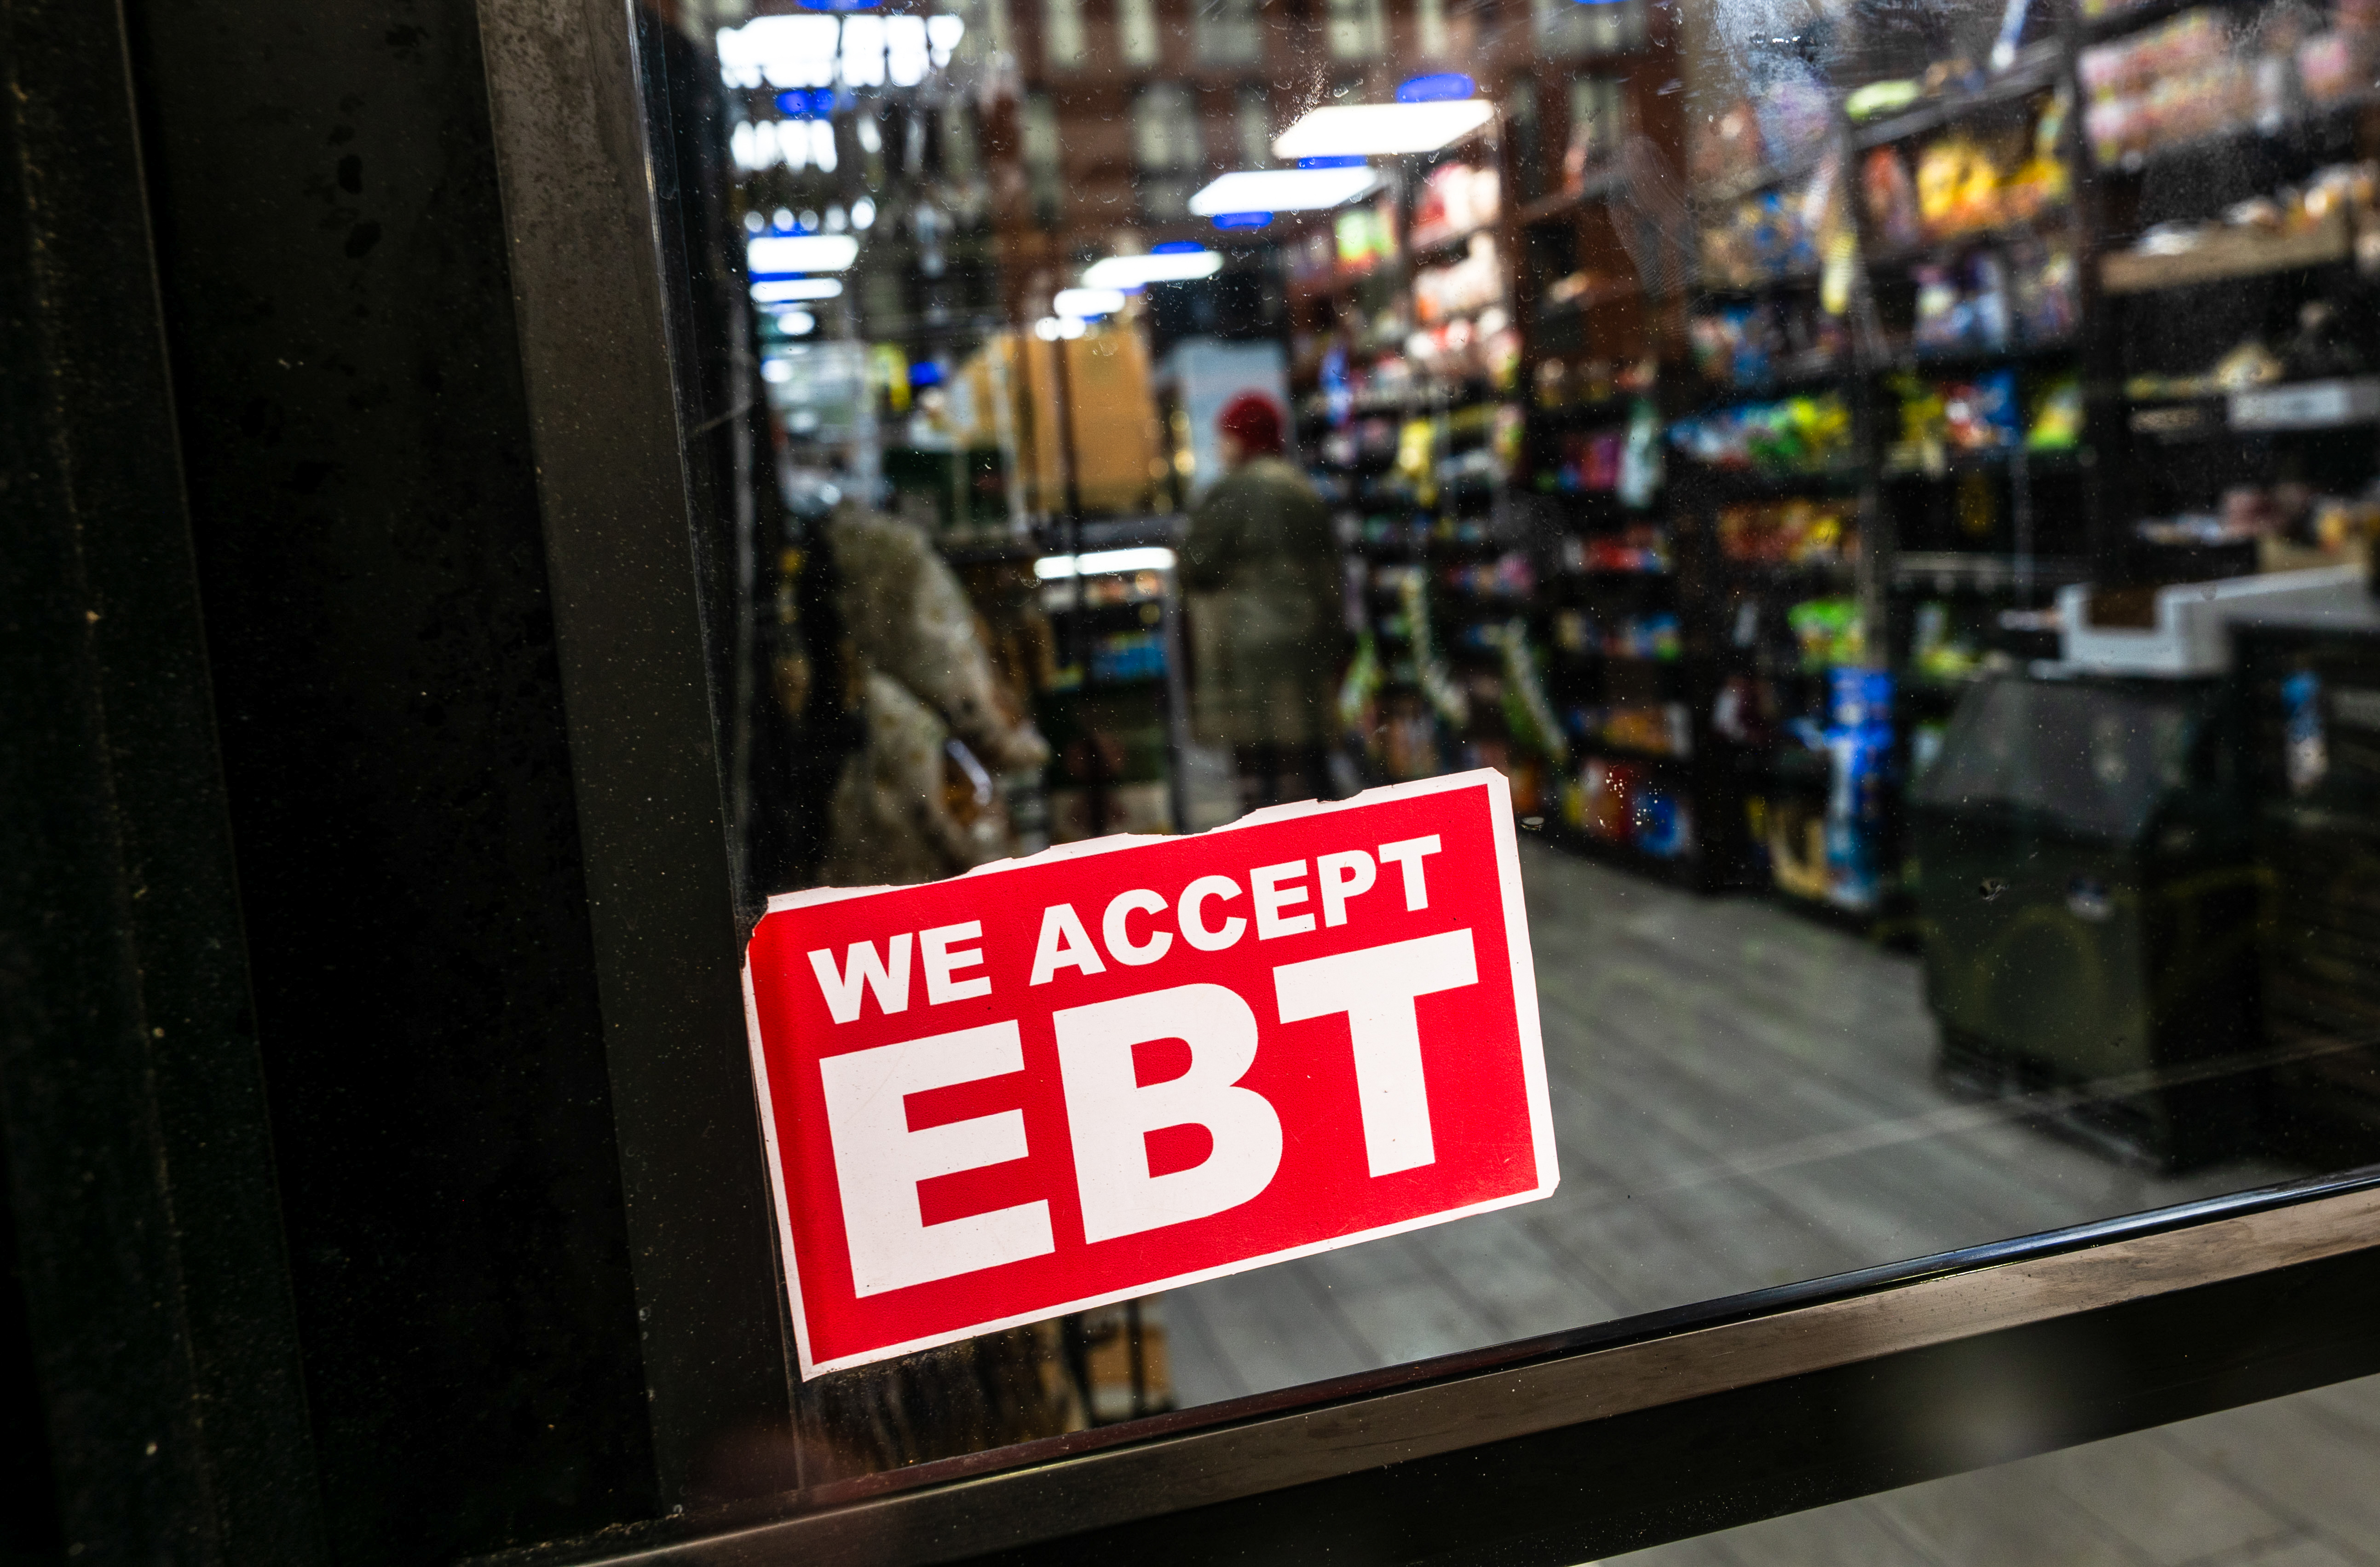


The Supplemental Nutrition Assistance Program (SNAP) has unexpectedly taken center stage in debates over the federal government shutdown.
Since funding for the program, formerly known as Food Stamps, ran out in October, Congress, President Donald Trump, and the federal courts have wrestled with what to do about feeding millions of Americans who depend on this benefit each month.
SNAP has grown in size and cost since its inception in 1964, as have many other social welfare programs.
Here is a closer look at the program, what it costs, the participation rates in different states, and how it has come to top $100 billion per year.
Participation
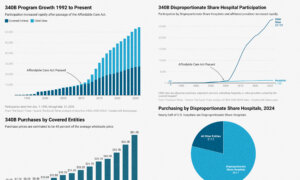
Participation in SNAP has grown dramatically over the past 50 years.
About 2 percent of Americans received SNAP benefits in 1970, according to data from the Department of Agriculture (USDA). Today, about 13 percent of Americans receive SNAP benefits, some 42 million people.
That is a 650 percent increase in the number of Americans who are unable to provide adequate food for themselves.
Participation spiked by 69 percent between 2008 and 2013, reaching a high of more than 45 million monthly recipients, largely because of the nationwide recession, according to the USDA. Between 2007 and 2009, national unemployment averaged 9.3 percent, and nearly 15 percent of Americans lived in poverty.
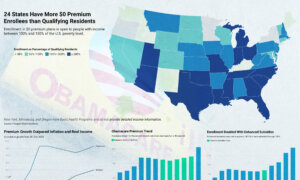
Participation rates vary. New Mexico is the state with the highest participation rate, at 21.2 percent of the population, and Utah has the lowest rate, at 4.8 percent.
The participation rate for many states mirrors their poverty rate. Some states have exceptionally high or low rates of SNAP participation compared with the rate of poverty.
Outliers on the high side are Arkansas, Massachusetts, Oregon, and Wyoming.
On the low side, Georgia’s SNAP participation rate is 12.5 percent, while its poverty rate is 12.6 percent.
Spending
SNAP spending has undergone two surges, reaching annual costs of more than $100 billion in 2024.
Spending shot up by 112 percent between 2008 and 2013, coinciding with the surge in enrollment. SNAP costs went up by another 98 percent during the COVID-19 pandemic era, when personal benefit amounts increased by 77 percent, according to The Epoch Times’ analysis of USDA data.
That is a 300 percent increase in 20 years, compared with an overall 50 percent increase in enrollment.
States with higher populations generally receive a larger share of SNAP benefits. California tops the list, receiving more than $1 billion per month, followed by New York at $647 million, Texas at $614 million, and Florida at $535 million.
Alaska and Hawaii both receive nearly double the average SNAP benefit per person, at $364 and $361 per month, respectively. Beneficiaries in New York ($218), Massachusetts ($216), and Tennessee ($203) receive the highest monthly average among the 48 contiguous states.
Incorrect Payments
As benefits have grown more generous, the error rate for payments has increased, according to an October report from Alliance for Opportunity, a conservative public policy organization.
The error rate, which measures how often states make mistakes in determining who gets SNAP benefits and how much they receive, hit 11 percent in 2022 and remained close to that level through 2024. That is three times higher than the rate in 2013.
That spike in payment errors reversed 15 years of continuous improvement, according to Alliance for Opportunity.
SNAP incorrectly disbursed nearly $11 billion in 2024. This figure breaks down into $9 billion in overpayments and $2 billion in underpayments for a net overpayment of $7 billion.
Before the COVID-19 pandemic, annual SNAP erroneous payments never exceeded $4.2 billion.
The increase was due to increased flexibility granted to states in administering the program, according to Alliance for Opportunity. States were allowed to let individuals self-attest income, simplify reporting, and take longer certification periods.
California led in the total amount of improper payments, at an estimated $1.4 billion. Approximately one in every nine dollars was sent out incorrectly.
New York followed closely behind, tallying $1 billion in improper disbursements; roughly one in every seven dollars was sent incorrectly.
Florida reported improper payments totaling $990.8 million, with an error rate of 15 percent.
Only payment errors greater than $56 per household were included in the error rate. However, all errors will be tallied in 2026 thanks to a provision of the One Big Beautiful Bill Act.
Since the program’s establishment in 1964, the federal government has fully funded SNAP benefits. Under the One Big Beautiful Bill Act, states with payment error rates higher than 6 percent will pay a cost share that covers 5 percent to 15 percent of benefits.
Most states will begin paying a state match if their error rates remain the same.
Fraud
SNAP has a significant amount of fraud, according to Robert Rector, senior researcher at The Heritage Foundation.
“The [reported] error rates are false and ridiculously low,” he said.
In some cases, recipients do not accurately report their income. There is an incentive to do so because the benefit is keyed to income level. Those who earn less receive higher amounts of aid.
Inaccurate counting of household members also contributes to fraudulent payments, according to Rector, who noted that the number of single mothers receiving SNAP benefits is about 35 percent higher than the number of single mothers in the country, as measured by the Census Bureau.
Work Requirements
“There are about 4 million people on food stamps that are called able-bodied adults without dependents,” Rector told The Epoch Times.
Congress changed the program’s work requirement rule in July. States are now implementing new guidelines to comply with the changes.
Able-bodied adults without dependents are required to work, volunteer, or take part in training for at least 20 hours per week, or 80 hours per month, to maintain their SNAP benefits.
Older people are granted an exemption from this requirement, but the age limit for the exemption is increasing from 54 to 64.
Generally, people ages 18 through 64 must meet this requirement to receive SNAP benefits for more than three months in any 36-month period.
Work can be something done in exchange for money, goods, or services.
Growth of Social Programs
President Lyndon Johnson introduced his vision to build a Great Society for the American people in 1963.
Over the next several years, Congress passed landmark legislation regarding social welfare programs that are still in place, including Medicare, Medicaid, and food stamps.
Those programs have been expanded over the years, and others have been added, including Temporary Assistance for Needy Families; the Low Income Home Energy Assistance Program; the Special Supplemental Nutrition Program for Women, Infants, and Children; federal housing assistance; and student loans and grants.
Federal spending on all social welfare programs, measured as a percentage of gross domestic product, rose from 0.27 percent in 1962 to 3.8 percent in 2024. That is an increase of more than 1,250 percent.
The federal poverty level fell by about 50 percent between 1962 and 2000, but it remains at about 11 percent today.