
Commentary
Out of the 79 school districts in Los Angeles County, 11 made double-digit moves in the fiscal rankings for the fiscal year ending June 30, 2023, over 2022. Was your district one of them?
It is important for you to know the fiscal standing of your school district and where it stands among its peers. To do that, a simple metric of dividing the district’s unrestricted net position from its annual financial report by the population it serves provides a per capita for easy comparisons.
The graph below gives you a quick look at how your school district is doing. Is it in the top half? Is it holding steady? Is it moving up in the rankings? Are you satisfied with the trustees that you voted for? Will there be a special assessment or parcel tax in your future?
Let’s review the big movers and see what we can find. If you’re inclined to attend a school board meeting, perhaps this will give you information with which to make inquiries.
Hacienda la Puente Unified made the biggest jump, moving up 23 places during the fiscal year. It had revenues in excess of expenditures of $104.6 million and an extraordinary item related to the sale of surplus property of $35.9 million. It also transferred $28.2 million out of restricted assets. This was offset by an additional net investment in capital assets of $27.5 million. With an increase in pension liability of $70.1 million and a decrease of other post-employment benefits (OPEB) of $9.5 million, most of the $86 million net reduction to the unrestricted net deficit is explained. All in all, it moved up 23 places.
Compton Unified had revenues in excess of expenditures of $202.2 million, thanks mainly to federal and state aid not restricted for specific purposes of $240.8 million. It transferred $90.9 million into restricted assets and purportedly allocated $32.6 million toward its net investment in capital assets. However, it actually invested $64.8 million in capital assets, while incurring no new related debt. Consequently, its unrestricted net deficit is probably higher than reflected on the statement of net position. It also incurred a large increase to its net pension and OPEB liabilities of $69.2 million. It moved up 17 places, continuing its upward momentum.
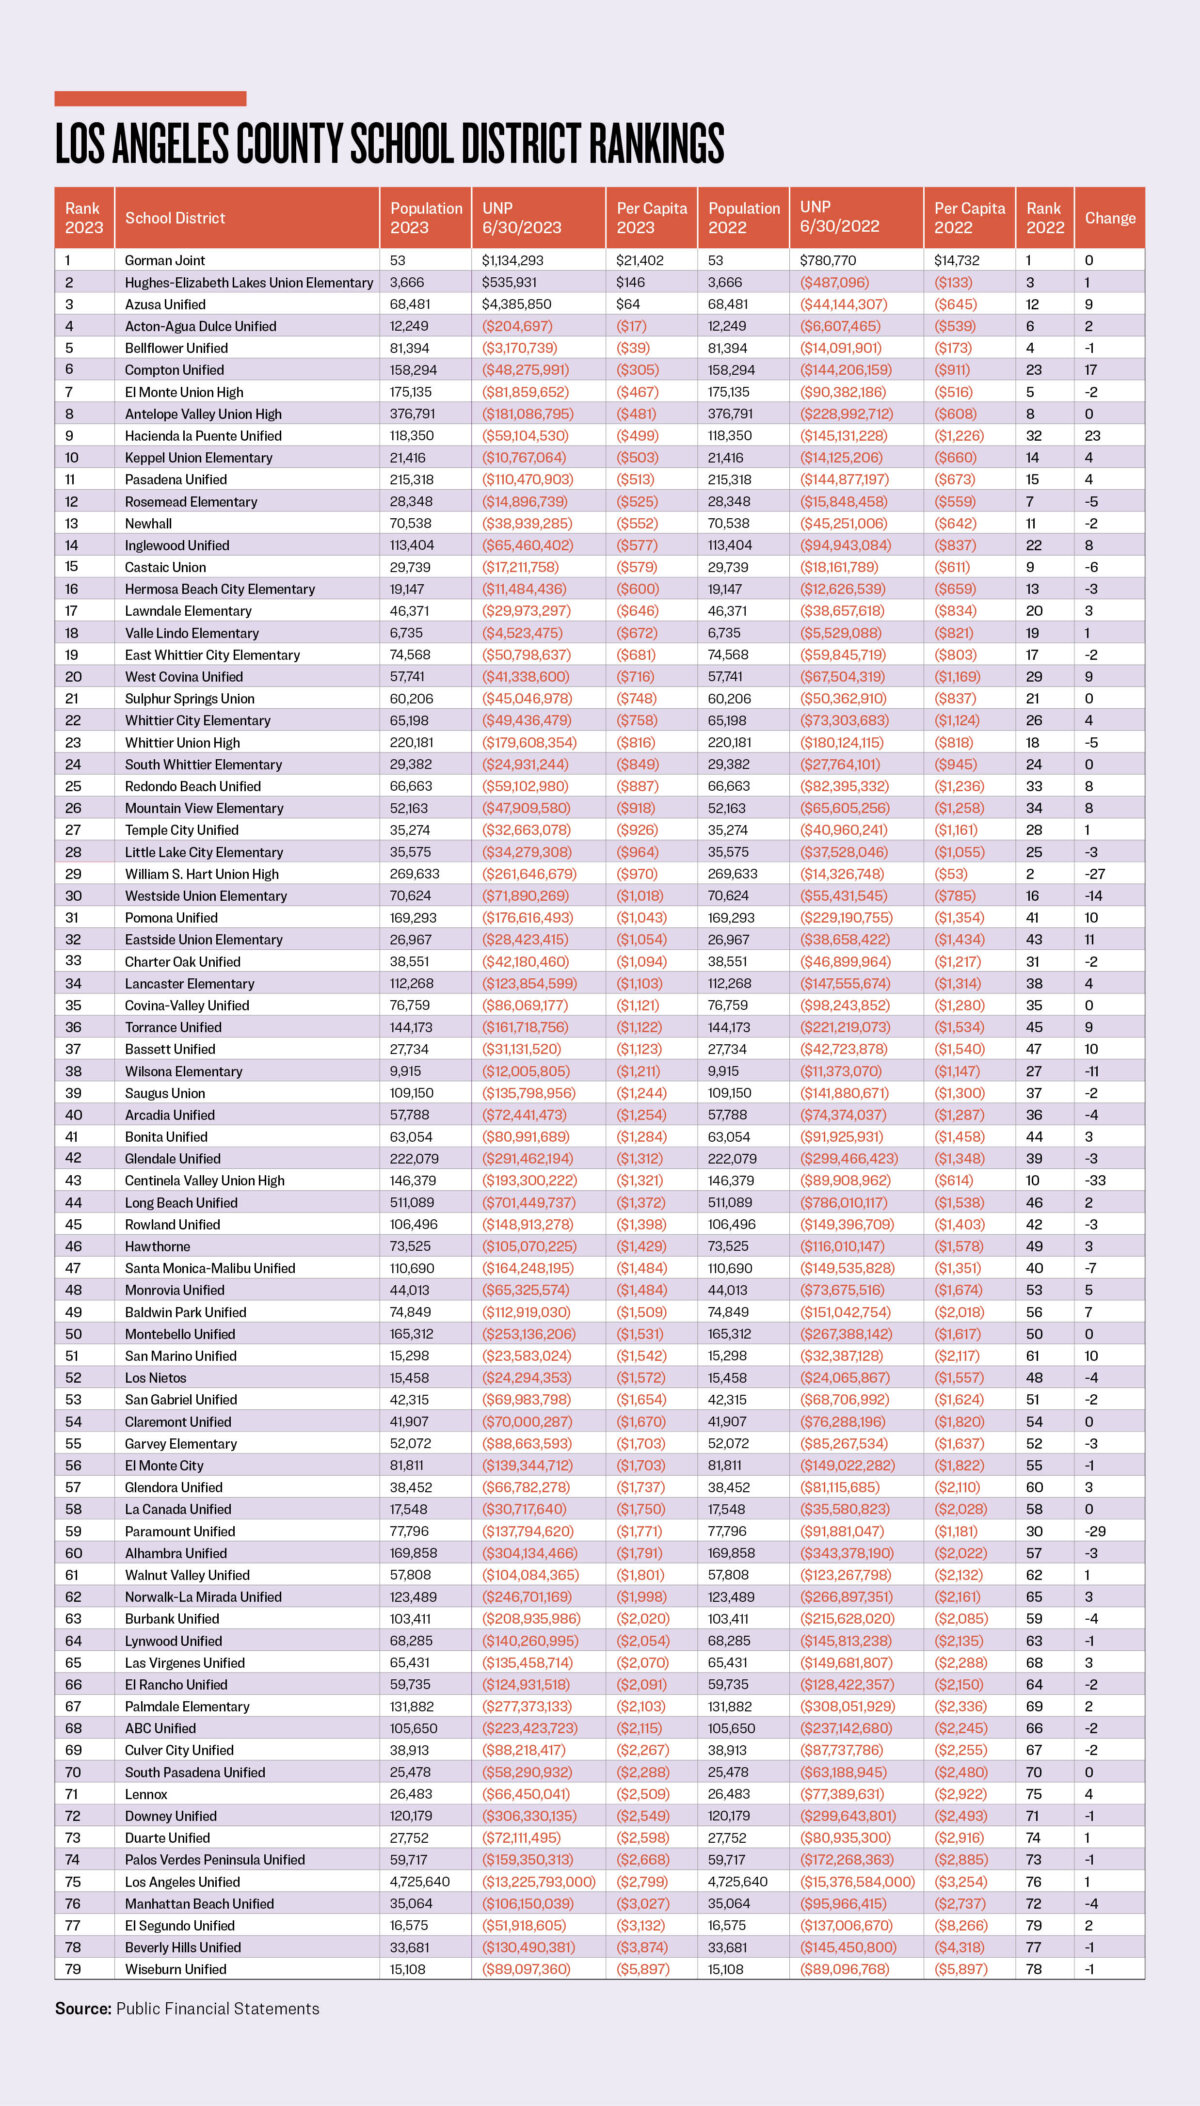
Eastside Union had revenues in excess of expenditures of $13.9 million and moved most of it, $11.4 million, into restricted assets. It disposed of furniture and equipment of $7.7 million. Combined, this explains its $10.2 million reduction of its unrestricted net deficit, its upward move of 11 places, and continued rise in the rankings.
Pomona Unified had revenues in excess of expenditures of $161.6 million and transferred $100.5 million of it into restricted assets and $8.5 million in net investment in capital assets. This explains its reduction to unrestricted net deficit of $52.6 million and its move up of 10 places. It also saw its aggregate net pension liability grow by $96 million. Get ready for tighter budgets in future years to meet this annual obligation.
Bassett Unified had revenues in excess of expenditures of $23.5 million and moved half of it, $10.9 million, into restricted assets. Thus, explaining the improvement of its unrestricted net deficit by $11.6 million and its upward move of 10 places. It also saw its pension liability increase by $14.6 million.
San Marino Unified had revenues in excess of expenditures of $12.3 million and invested $3 million into its net investment in capital assets, explaining the bulk of the improvement to its unrestricted net deficit of $8.8 million and its jump up of 10 places. Ballot Measures E and R were approved by the District’s voters providing for parcel taxes. $6 million was raised for “other specific purposes,” which may explain half of the net revenues. But, it does show what a school district is capable of in increasing your property tax bill.
Wilsona had revenues in excess of expenditures of $5.5 million and moved $5.7 million into restricted assets, causing its unrestricted net deficit to increase by $632,735. While other districts within its per capita range were moving up, this slight decline resulted in a drop of 11 places.
Westside Union had revenues in excess of expenditures of $30.2 million, but moved $49.3 million into restricted assets, explaining the increase in its unrestricted net deficit of $16.5 million and its drop of 14 positions.
For the rankings for the year ending June 30, 2023, I was a little hard on William S. Hart Union High for an oversight. It provided a lesson on proofing and double-checking the work product before it goes out the door. I’m happy to report that it adjusted the net investment in capital assets by $263 million, which was the major reason for its unrestricted net deficit increasing by $247 million and its drop of 27 positions.
Paramount Unified had revenues in excess of expenditures of $55.7 million and moved a whopping $103 million into restricted assets, increasing its unrestricted net deficit by $45.9 million and dropping 29 places.
The biggest drop was made by Centinela Valley Union High. Although it had revenues in excess of expenditures of $35.3 million, it socked away $99.3 million into restricted assets and increased its net investment in capital assets by $39.5 million. This explains the increase in its unrestricted net deficit of $103.5 million and its drop of 33 positions.
Although the 79 school districts in Los Angeles County reduced their cumulative unrestricted net deficits by $2.9 billion, there were still a few that went in the opposite direction. Now you have some background on the landscape and can ask your district’s Chief Business Officer more detailed and deeper questions.
The goal is to have your district moving in an upward direction and not exploring the possibility of a parcel tax, which will impact all of the residents in the district, directly on their property tax bills, or indirectly through increases in their rent.