

Commentary
Out of all the Bay Area’s 101 cities to complete their annual audits and issue their annual comprehensive financial reports (ACFR), Portola Valley was last for the fiscal year ending on June 30, 2021 and once again for June 30, 2022.
City staff for Portola Valley told me, “We are currently working on the FY 22-23 audit and should have those statements ready by the end of February.” Let’s hope that the cities of Sonoma and Tiburon complete theirs by then as well.
Once all the actual ACFRs in a region are published, an accurate analysis can be done of how each city fared. California’s now 483 cities are ranked by region, and Caltrans District 2 has 101 cities, the most of any of the nine geographical regions.
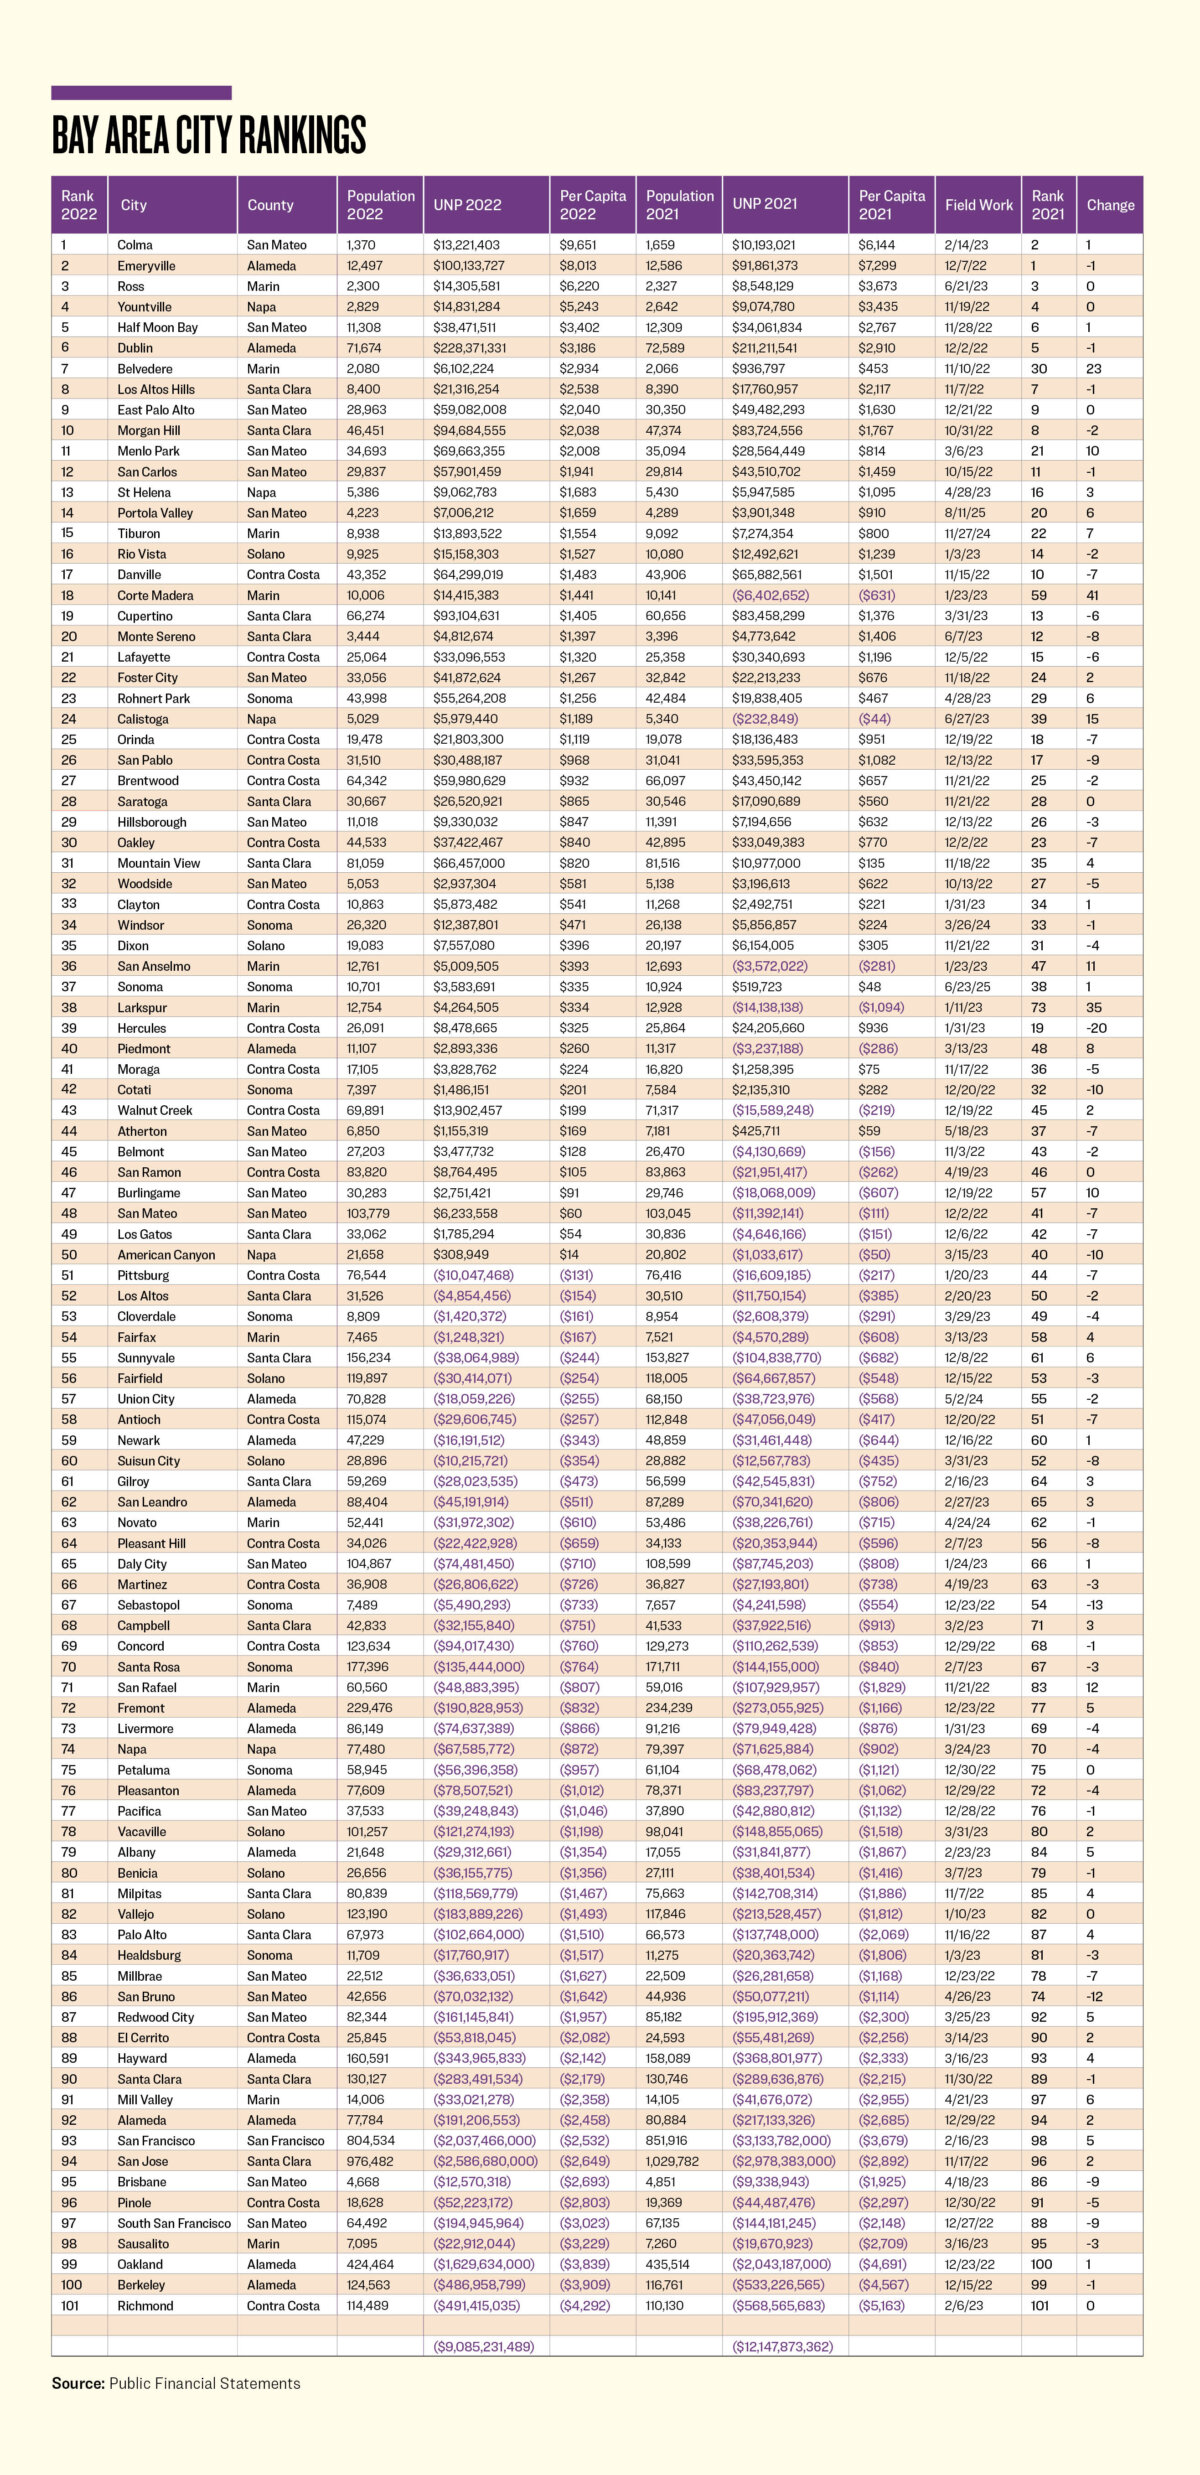
The 2022 rankings are provided in the graph below, showing each city’s unrestricted net position (UNP). Half of the cities, 50, are in positive territory, where every city should want to be. And, overall, the cities reduced their combined unrestricted net deficit by $3 billion, with the city and county of San Francisco accounting for a third of the improvement. But the rankings also show why “The City by the Bay” and Oakland are constantly in the news regarding their fiscal concerns.
The conclusion of the auditor’s field work is also provided. It shows that 49 cities were able to accomplish this critical task within six months, which is the recommended completion date. Another 35 cities met this transparency requirement by March 31, 2023. Another eleven cities limped in by June 30. Windsor finished by March 26, 2024, followed by Novato (April 24), Union City (May 2), Tiburon (Nov. 27), Sonoma (June 23, 2025) and Portola Valley (Aug. 11, 2025, but not officially released until January 2026).
Now you can appreciate why California State Sen. Steven Choi authored SB 595 in last year’s legislative session, implementing penalties for those cities who do not complete this reporting courtesy in a timely manner. It passed without opposition and was signed by Gov. Gavin Newsom in October.
A dozen cities moved up or down the rankings by double digits. The per capita is simply taking the unrestricted net position (UNP) for governmental activities from the statement of net position and dividing it by the city’s population. As can be seen, there is plenty to discuss.
The biggest mover, for the second year in a row, was the town of Corte Madera, jumping up 41 places! The reasons are a little odd, but let me try to explain. A major component of the improvement is a purported adjustment of $11.1 million to the beginning unrestricted net position. The financial report mentions “as restated” 21 times but does not provide the specifics in an understandable manner. The revenues in excess of expenditures were $23.7 million. There was a net investment in capital assets during the year of $11.8 million, but it isn’t reflected in the noncurrent assets. And $4.8 million was taken from restricted assets. How all these components came together to increase the unrestricted net position by $20.8 million is a mystery to me.
In the management’s discussion of the statement of net position on page 8, the condensed version of the statement of net position doesn’t match up with the actual statement. We’ll have to see if things settled down when we review the 2023 annual rankings. But, as a former audit partner for a large local Certified Public Accounting firm, I’m going to call out my concerns with the hope that the city’s audit partner for this engagement did a more thorough final review for the 2023 ACFR. The integrity of these rankings demands it.
The city of Larkspur reported Pension Expenses as $15.4 million in revenues on its Statement of Activities in a separate column, which is very unusual. But it increased the revenues over expenditures to $27.8 million. Decrease this amount by the net investment in capital assets of $11.3 million, and one gets $16.5 million. This explains the bulk of the increase in the city’s unrestricted net position of $18 million and moving it up 35 places.
The city of Belvedere had a third straight year of revenues in excess of expenditures, with $7.2 million, and moved $1.2 million into restricted assets, explaining the bulk of the $5.2 million increase in its unrestricted net position. The net result moved this city of just over 2,000 residents 23 places.
The city of Calistoga had revenues in excess of expenditures of $9.1 million and set aside $2.5 million in restricted assets, explaining the $6.2 million improvement in its unrestricted net position and its 15 place move up the rankings. Perhaps its renowned castle has been a strong draw—I know it is worth visiting.
The city of San Rafael had revenues in excess of expenditures of $77.7 million and increased its investment in capital assets by $18.2 million, explaining the massive improvement to its unrestricted net deficit of $59 million. It moved up 12 places.
The city of Burlingame had revenues in excess of expenditures of $24.7 million and moved $5.5 million out of restricted assets. It also increased its investment in capital assets by $9.4 million, explaining the improvement in its unrestricted net position of $20.8 million. It moved up 10 places.
The city of Menlo Park had revenues in excess of expenditures of $24 million. It had no material change in its noncurrent assets but increased its bonds payable by $18.7 million, explaining the $15 million reduction in net investments in capital assets. Restricted assets were reduced by $4.4 million, leaving a combined improvement of $43.4 million and explaining the $41.1 million increase in its unrestricted net position. This allowed the city to move up 10 places.
The city of American Canyon dropped by 10 places by standing still. In the last rankings, it was in 40th place with an unrestricted net deficit of $1 million. This time it moved into positive territory and joined the 50 counties with unrestricted positions in the black but landed in 50th place. It’s the wonderful mystery of math.
The city of Cotati had revenues in excess of expenditures of $3.8 million, put $1.7 million in restricted assets and a net of $2.6 million into its net investment in capital assets. The half-million decline in its unrestricted net position caused it to drop 10 places.
The city of San Bruno had revenues in excess of expenditures of $19.3 million, putting $30.6 million in restricted assets and $11.8 million in its net investment in capital assets. This explains the increase in its unrestricted net deficit of $20 million and its dropping 12 places.
The small city of Sebastopol, renowned for famous resident Luther Burbank, had expenditures in excess of revenues of $393,522. Moving $532,000 into restricted assets and increasing its net investment in capital assets by $347,000, which explains the increase in its unrestricted net position of $1,247,000. The three components contributed to the city dropping 13 places.
The city of Hercules has a curious story. Its revenues exceeded expenditures by $12.5 million. But it had a “Special Item” expenditure of $39.6 million. The explanation in Note 17 was rather vague:
“After the negotiation with the California Department of Finance, the City recognized the loan write off in the amount of $50,173,974 during the year ended June 30, 2022 and it was reported as a special item on the financial statements.”
The explanation in Note 7 is more helpful. After Gov. Brown shut down the Redevelopment Agencies in the state, some had disputes with Sacramento. The amounts were a resolution and settlement with the California Department of Finance.
The city removed $10.8 million from restricted assets and reduced its net investment in capital assets by $9.4 million, without a similar reduction in its capital assets (something that needs further elaboration by the city’s finance department). Combined, it reduced the unrestricted net position by $6.9 million, dropping it 20 places.
Once Portola Valley satisfies its transparency commitment, the 2023 rankings can be produced. In the meantime, if you live in the Bay Area and your city has caught your attention, then you have something to discuss with your elected council members.