
Commentary
How is your city doing? My city just announced that it’s looking at putting two measures on the ballot to increase taxes and fees. And based on its low ranking, it either needs to reduce spending and debts or raise revenues or both. My city refused to reduce debts, so suggesting tax increases came as no surprise.
If you reside in San Diego County, the last annual comprehensive financial report for the fiscal year ending on June 30, 2024, was just released by the city of La Mesa. So, we can finally see how the 18 cities are faring.
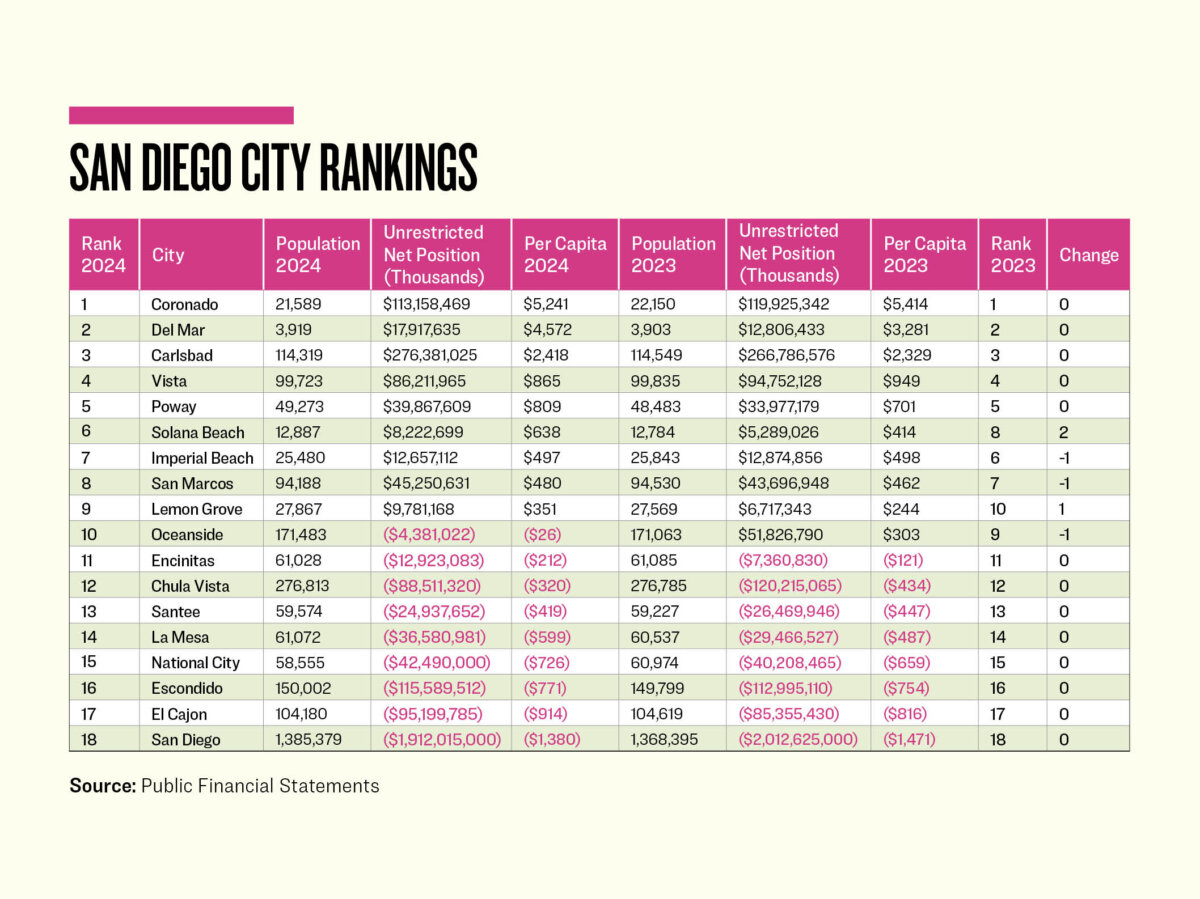
The graph below shows the key statistics. The first is the city’s population. The second is the city’s unrestricted net position for governmental activities, provided on the statement of net position in the basic financial statements. Dividing the population into the unrestricted net position (retained earnings in the private sector) provides a per capita, which can be ranked.
The goal is to have a positive result. A negative per capita indicates what each resident would have to chip in if the city wanted to be at a zero level. And it is also a good indicator of two things: poor fiscal management and, therefore, the potentiality of a local tax increase.
As can be seen, there is good news, as half of the cities are in positive territory. The other half are burdened with unfunded actuarial accrued liabilities from defined benefit pension plans and retiree medical plans, also characterized as other post-employment benefits.
There was no movement in the rankings for the top five and bottom eight cities. So, let’s discuss what occurred with the middle five cities during the fiscal year.
The city of Solana Beach had revenues in excess of expenditures of $10.7 million. It transferred $5.1 million into restricted assets and allocated $2.7 million toward its net investment in capital assets, with the difference, $2.9 million, increasing its unrestricted net position. This resulted in moving up two positions, leaping ahead of Imperial Beach and San Marcos, which did not increase their unrestricted net positions as significantly.
The city of Imperial Beach had revenues in excess of expenditures of $5.4 million. It also transferred funds into restricted assets, $1.1 million, and pursued $4.5 million toward its net investment in capital assets. Combined, it reduced its unrestricted net position by $200,000, explaining its dropping one position.
The city of San Marcos had revenues in excess of expenditures of $19.9 million. It transferred $2.9 million into restricted assets and appropriated $15.5 for its net investment in capital assets. Combined, its unrestricted net position grew by $1.5 million. Most of the increase was for construction in progress. The city dropped one place.
The city of Lemon Grove had revenues in excess of expenditures of $7.0 million and a prior period adjustment of $3.5 million. It followed the same pattern as the previously mentioned cities, by transferring $1.9 million into restricted assets and allocating $5.5 million to its net investment in capital assets. Combined, its unrestricted net position grew by $3.1 million. The prior period adjustment was explained in note 18 of the financial statements, having to do with the previous classification of certain land holdings. It moved up one position.
The big story for this particular year may be the city of Oceanside. It had revenues in excess of expenditures of $59 million. It followed suit with the previous four cities, but with much larger amounts. It transferred $76.3 million into restricted assets and disbursed $38.9 million toward its net investment in capital assets. The result was a $56.3 million reduction—large enough to convert its bottom line to an unrestricted net deficit of $4.4 million.
Most of the transfer to restricted assets, $71.6 million, was put in a new account vaguely titled “general government.” This is a general term for what cities generally do. But a review of the footnotes and disclosures in the city’s annual comprehensive financial report, in which one would generally find an explanation, was silent. So, one would generally have to review the minutes of the city council meeting or meet with the finance director for an explanation.
Overall, the cities examined kept general expenses within the amount of revenues collected during the fiscal year. And San Diego County becomes the second district of nine in California to release its annual comprehensive financial reports.
Two-thirds of the cities completed their audit field work before Dec. 31, 2024, the recommended completion date. Grace is given until March 31, 2025, and Escondido, Del Mar and Santee made it under this deadline. The cities that held up the process were Lemon Grove (May 15, 2025), La Mesa (Oct. 22, 2025), and National City (Nov. 12, 2025).
But there is an elephant in the room. The city of San Diego is still in last place, so it’s not hard to understand why Measure B was put before its residents, and barely passed, to charge 226,495 residences $42.76 per month for trash pickup.
Let’s hope that all 18 continue to enjoy satisfactory revenues and more prompt reporting for the year ending on June 30, 2025.