

Commentary
One would think that a few years after the COVID-19 lockdowns in California, things would settle down for school districts. But in Los Angeles County, for the fiscal year ending on June 30, 2024, 10 of the districts moved up or down the annual fiscal rankings by double digits.
It’s a time-consuming chore to go to the website of all 79 districts, find the fiscal services department, and maybe view a webpage that provides the annual audited financial statements.
Transparency-focused districts provide a listing with links, those who are ambivalent encourage you to dig through the board minutes, and those who don’t care need to be emailed and cajoled. One quarter into the new fiscal year, a dozen districts still don’t have this information available. But there is good news. I was able to obtain these audited financial statements from the California Policy Center’s Local Fiscal Health Dashboard.
If you live in one of the following school districts, let the chief business officer know that it is a common courtesy to post financial information and that it is done by the vast majority of districts: Burbank Unified, Castaic Union, El Monte City, Hawthorne, Hughes-Elizabeth Lakes, Inglewood Unified, La Canada Unified, Lawndale Elementary, Little Lake City Elementary, Newhall, Pomona Unified, Saugus Union, and Wilsona Elementary.
Here’s more good news. The number of timely school districts is 66, as they completed the audit work on or before the technical due date, Dec. 31, 2024. Ten other districts were finished by March 31. But Monrovia Unified and Newhall completed theirs on April 8, and the last place winner was William S. Hart Union High, a district I have been using as an example for concerns regarding net investment in capital assets, on June 2.
Let’s review the graph below and discuss the major movers for the year.
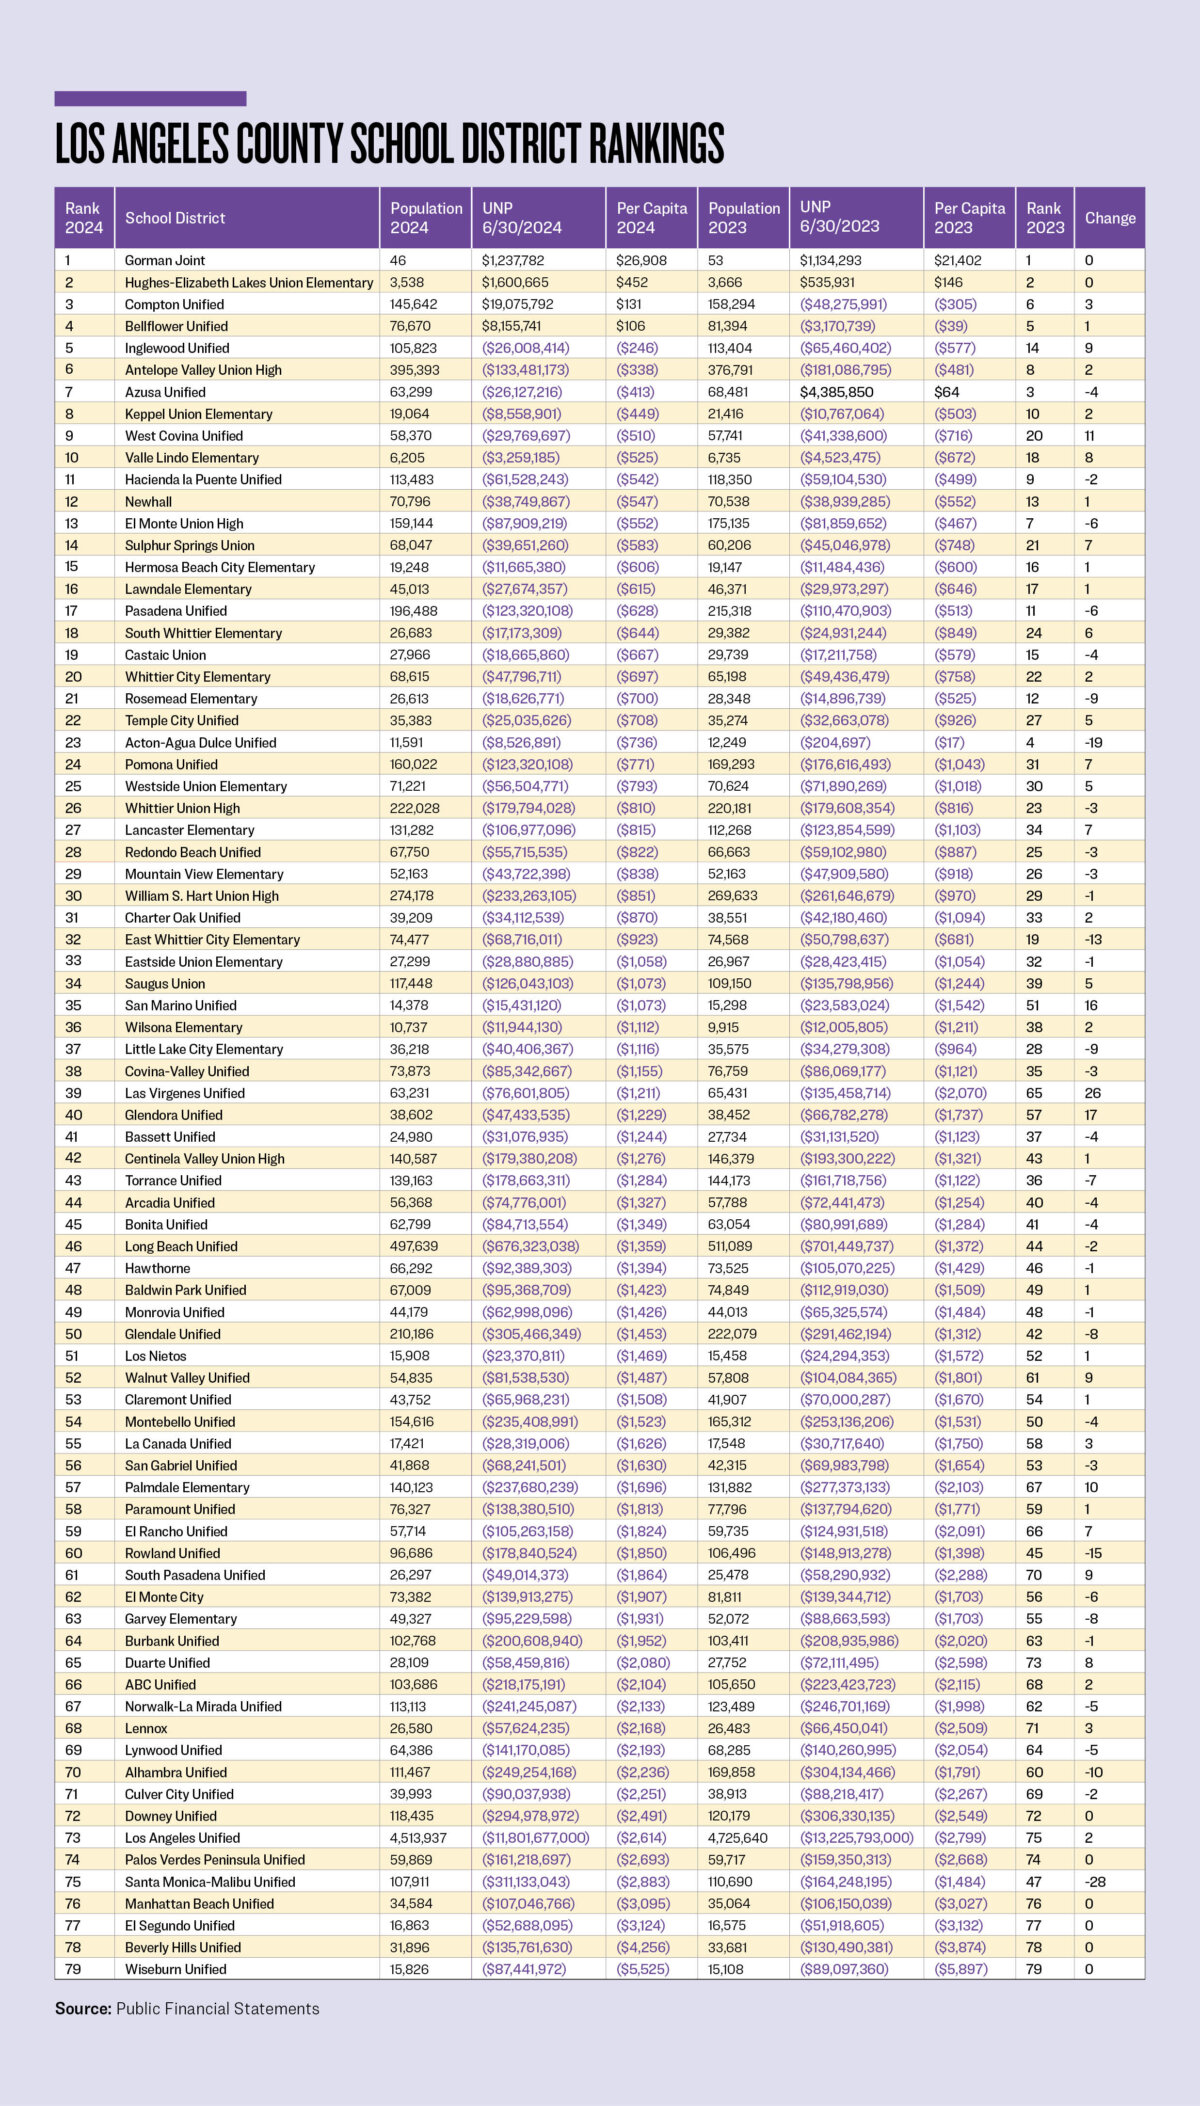
Las Virgenes Unified was the biggest upward mover, rising 26 places. Oddly, it had expenditures in excess of revenues of $2 million. It took on $83.3 billion in new general obligation bonds but only spent $13.1 on capital assets. The district reduced its net investment in capital assets by $65.8 million. This reduced the unrestricted net deficit by $76.6 million. But borrowing against capital assets to improve the net position is counterintuitive and something that needs to be pursued with the Government Accounting Standards Board for an appropriate solution. Azusa Unified utilized a similar scheme to move up 43 places in 2022. Even AI couldn’t help me with this unique strategy. Stay tuned.
Glendora Unified had revenues in excess of expenditures of $6 million. It reduced its net investment in capital assets by $17.1 million, with no similar movement on the statement of net position (balance sheet). In the 2021 rankings, I would recommend throwing this one into the “Hart Hopper” category, as in William S. Hart Union High. In total, Glendora’s unrestricted net deficit was reduced by $19.3 million, moving it up 17 places.
San Marino Unified continues its climb up the rankings the old-fashioned way (see 2023 rankings). It had revenues in excess of expenditures of $9.7 million, easily explaining how its unrestricted net position improved by $8.2 million and why it moved up another 16 places.
West Covina Unified had revenues in excess of expenditures of $7.1 million and transferred another $7.2 million out of restricted assets, explaining the $11.6 million improvement in its unrestricted net deficit and moving up 11 places.
Palmdale had revenues in excess of expenditures of $95.7 million, transferred $59.1 million into restricted assets, and allocated $3.1 million toward its net investment in capital assets, explaining the net decrease in its unrestricted net deficit of $33.5 million and its move upward by 10 places.
Alhambra Unified moved down 44 places in 2018. It moved up 22 places in 2019. It dropped nine places in 2020. Then it dropped another 14 places in 2021. In 2022, it dropped another four positions. And three more in 2023. So what did it do for an encore? It dropped another 10 places in 2024! But this year, the story is not the finances. It’s the population that it serves, which has declined dramatically, thus affecting its per capita. The population served numbers are acquired from the Census Reporter website, but it only provides current data and not prior years.
East Whittier City had expenditures in excess of $21.5 million and transferred $4 million out of restricted assets, explaining the $17.9 million increase to its unrestricted net position and its drop of 13 places.
Rowland Unified had revenues in excess of expenditures of $22 million but transferred $36.7 million into restricted assets and $15.2 million into net investment in capital assets. This resulted in an increase in its unrestricted net deficit of $29.9 million and its drop of 15 places.
The smaller district of Acton-Agua Dulce Unified had expenditures in excess of revenues of $887,831. It moved $762,148 into restricted assets. And it incurred a supposed $6,672,215 increase in its net investment in capital assets, which was not reflected in the balance sheet, putting it into the “Hart Hoppers.” But this increased the unrestricted net deficit by $8,322,194 or nearly 42 times the 2023 balance. And so it dropped 19 places.
Santa Monica-Malibu Unified had revenues in excess of expenditures of $14 million. It moved $204.5 million into restricted assets. It incurred $42.7 million more in general obligation bond debt than it spent on capital assets, and like Las Virgenes Unified, the net result only increased its unrestricted net deficit by $146.9 million, dropping it 28 places.
The city of Santa Monica itself is already dealing with significant fiscal pressures as a result of newly settled litigation resulting from 2019’s Assembly Bill 218.
Having worked through the COVID-19 pandemic lockdown instituted by California Gov. Gavin Newsom, the next wave of fiscal hits is starting to be felt. And the next rankings, for the fiscal year that ended on June 30, will provide the beginning of the damages. For even more good news, the districts in total reduced their combined unrestricted net deficits by $1.8 billion. The question is, will this trend continue?
Almost all of California’s school districts already suffer from having more debt than assets. The recent spree of lawsuits due to inappropriate behavior by certain school staff members many years ago and the related issuance of bonds to pay the financial settlements will only make it even more difficult to balance school budgets. That’s why watching how your school district is faring each year by reviewing the rankings is all the more important.