
San Diego County has 42 school districts. With Los Angeles Unified School District facing threats of takeover by the Los Angeles Department of Education, and even concerns coming from the State’s Capitol about Sacramento City Unified School District, how are San Diego County’s districts doing?
There are two ways to get a quick reading. One is to go to the California Policy Center’s Center for Accountability’s Local Fiscal Health Dashboard and get a letter grade based on 10 factors found on its annual audited financial statements. Only one out of every five districts received a grade of B or better for the fiscal year ending June 30, 2025. Something needs to change.
The second is to review the annual rankings once all of the audits are finally available. This is a time-consuming task and some districts should improve their websites. The good news is that Gov. Gavin Newsom recently signed Senate Bill 1126 by Republican state Sen. Steven Choi of Irvine. It requires posting the reports within 30 days of being approved by school boards.
By reviewing the audited financial reports and dividing the unrestricted net position (UNP) for governmental activities on the statement of net position (balance sheet) by the district’s population, a per capita is derived which can be ranked.
What we find in the graph below is that seven school districts moved up or down the rankings by five or more positions and merit a review as to why. And like in the fiscal year ending June 30, 2024, we find numerous accounting irregularities.
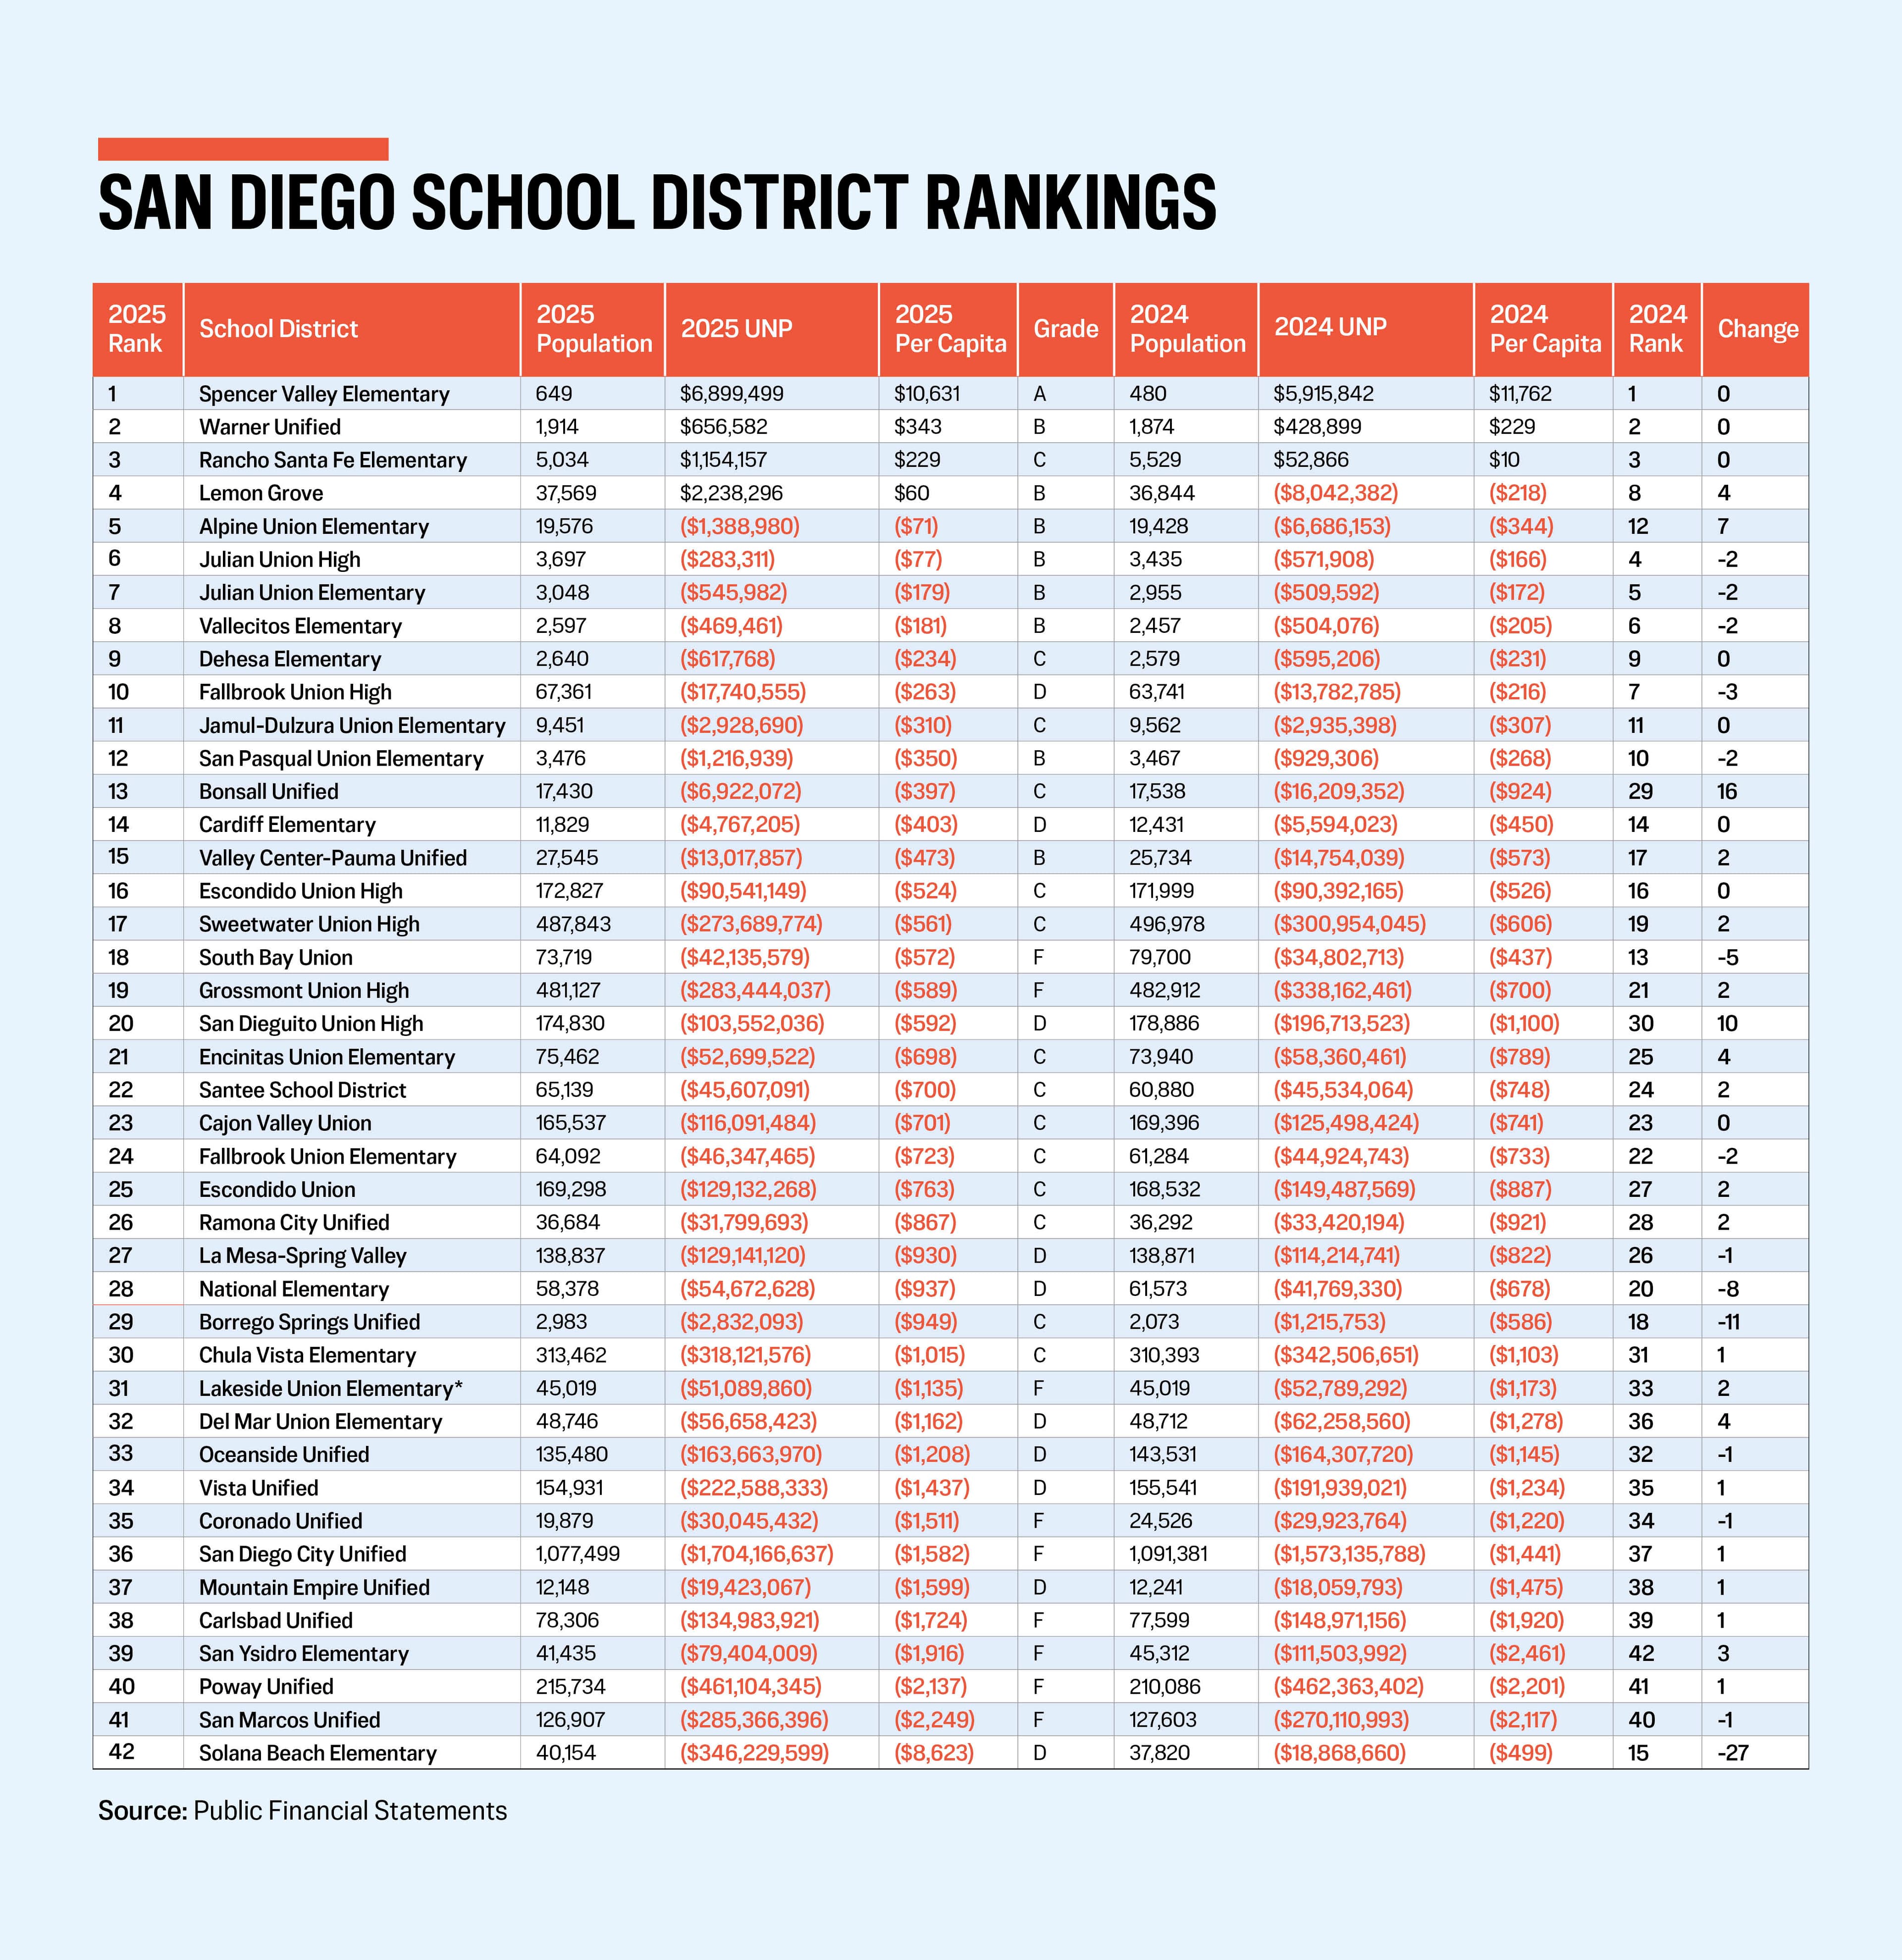
Of the three districts with upward movement, Bonsall Unified took first place. It had revenues in excess of expenditures of $822,908, which was offset by $883,205 for a Government Accounting Standards Board (GASB) No. 101 implementation adjustment for compensated absences. It only transferred $390,335 into restricted assets. But for some reason, it reduced its net investment in capital assets by $8,957,242. This should result in a decrease of $9,407,874 to the unrestricted net deficit, but the actual decrease was $9,287,280. Trying to explain the $120,594 difference is a mystery.
Trying to explain a $9 million reduction in capital assets is an even bigger mystery. The statement of net position shows no material movement in capital assets or long-term liabilities. With these unexplainable components, and no requirement by GASB to explain the details of the changes to the net investment in capital assets, residents are left to inquiring about the accounting oddities with the district’s chief business officer. Bonsall Unified moved up 16 places as a result.
Second place goes to San Dieguito Union High, but the details for its big move are also concerning. It had revenues in excess of expenditures of $18.3 million and a similar GASB adjustment, but for $2 million. It transferred $23.8 million out of restricted assets.
Here’s where it gets weird. Capital assets on the statement of net position (balance sheet) grew by $22.9 million and long-term liabilities decreased by $32.3 million. This should indicate that the net investment in capital assets should have increased by some $55.2 million. But the opposite occurred. The net investment in capital assets went from $21.6 million to a negative $31.5 million, a $53.1 million decrease!
The result that was reported is a reduction in the unrestricted net deficit of $93.2 million ($18.3 minus $2.0 plus $23.8 plus $53.1). This curious swing moved the district up 10 places. Not bad for a school district with an “F” grade.
Alpine Union had revenues in excess of expenditures of $3.6 million and the GASB adjustment of $0.2 million. It transferred $1.6 million out of restricted assets and saw its net investment in capital assets decrease by $0.3 million. Combined, the unrestricted net deficit decreased by $5.3 million. Although why the net investment in capital assets had a decrease is curious based on the amounts on the balance sheet. GASB could clear this recurring confusion up by requiring a disclosure detailing the composition of the net investment in capital assets amount. The district moved up seven places.
South Bay Union had expenditures in excess of revenues of $3.4 million and transferred $3.5 million into restricted assets. It reduced its net investment in capital assets by $8.3 million, which should have improved its unrestricted net deficit by $1.4 million. However, it actually increased the deficit by $7.3 million, an $8.7 million swing. Why? This is a question residents should inquire of the district’s chief business officer and explains the district’s dropping five places.
National had expenditures in excess of revenues of $19 million and the GASB adjustment of $2.1 million. It transferred $5 million into restricted assets and reduced its net investment in capital assets by $13.2 million (mostly related to issuing some $20 million in general obligation bonds). The net result should have been an increase to its unrestricted net deficit of $25.1 million. However, it only grew by $12.9 million. Once again, this is another example of where a disclosure of the components of net investment in capital assets would be helpful to the reader of the financial statements. It only dropped eight places.
Borrego Springs Unified, which is a great place to visit in autumn, had revenues in excess of expenditures of $2.5 million that was offset by $0.4 million from the GASB adjustment. It transferred $1.7 million into restricted assets and appropriated $2.0 million towards its net investment in capital assets. Combined, the unrestricted net deficit increased by $1.6 million. It dropped 11 places.
Solana Beach takes the prize for the biggest drop in the rankings, continuing its downward slide. It had revenues in excess of expenditures of $10.8 million and the GASB adjustment of $2 million. It transferred $1.4 million into restricted assets. Here’s where not documenting the net investment in capital assets account goes off the charts. The district moved $334.7 million into this account. The amount for non-current assets on the balance sheet is only $249.3 million.
The district’s unrestricted net deficit grew by $327.3 million. This appears impossible. Consequently, the district dropped 27 places.
It’s time to mandate that the “net investment in capital assets” account be fully disclosed in the audited financial statement disclosures. Are you listening, GASB? It would also be advisable for the chief business officers of the districts with major changes in their unrestricted net deficits to do a double check on the numbers. Borrego Springs Unified shows how simple the analysis should be. As they say, something needs to change.