

Commentary
Los Angeles County has 80 public school districts, and a review of their audited financial statements for the years ending June 30, 2017, and 2018 shows a dramatic amount of fiscal activity.
The big news is that around this time the Governmental Accounting Standards Board, also known in the Certified Public Accounting world as GASB, finally required municipalities, including school districts, to report unfunded liabilities for defined benefit pension plans and other post-employment benefits, like retiree medical plans, on their balance sheets.
How did this work out for the 8 percent of California’s school districts that are located within the Los Angeles County borders? Let’s take a look, from the implementation of this long overdue fiscal shift in 2017 and 2018 to the current fiscal years ending June 30. Reviewing the financial dynamics will provide a baseline for these districts moving toward their 2024 audited reports.
The graph below provides the 80 districts, the populations they serve, and their unrestricted net positions (UNP) for 2017 and 2018. Dividing the population into the UNP provides a temperature gauge on the fiscal strength of each district. The UNP is the same as the owner’s equity or retained earnings on the financial statement of a for-profit business. It’s calculated by taking assets and subtracting liabilities—and the result should be zero or better.
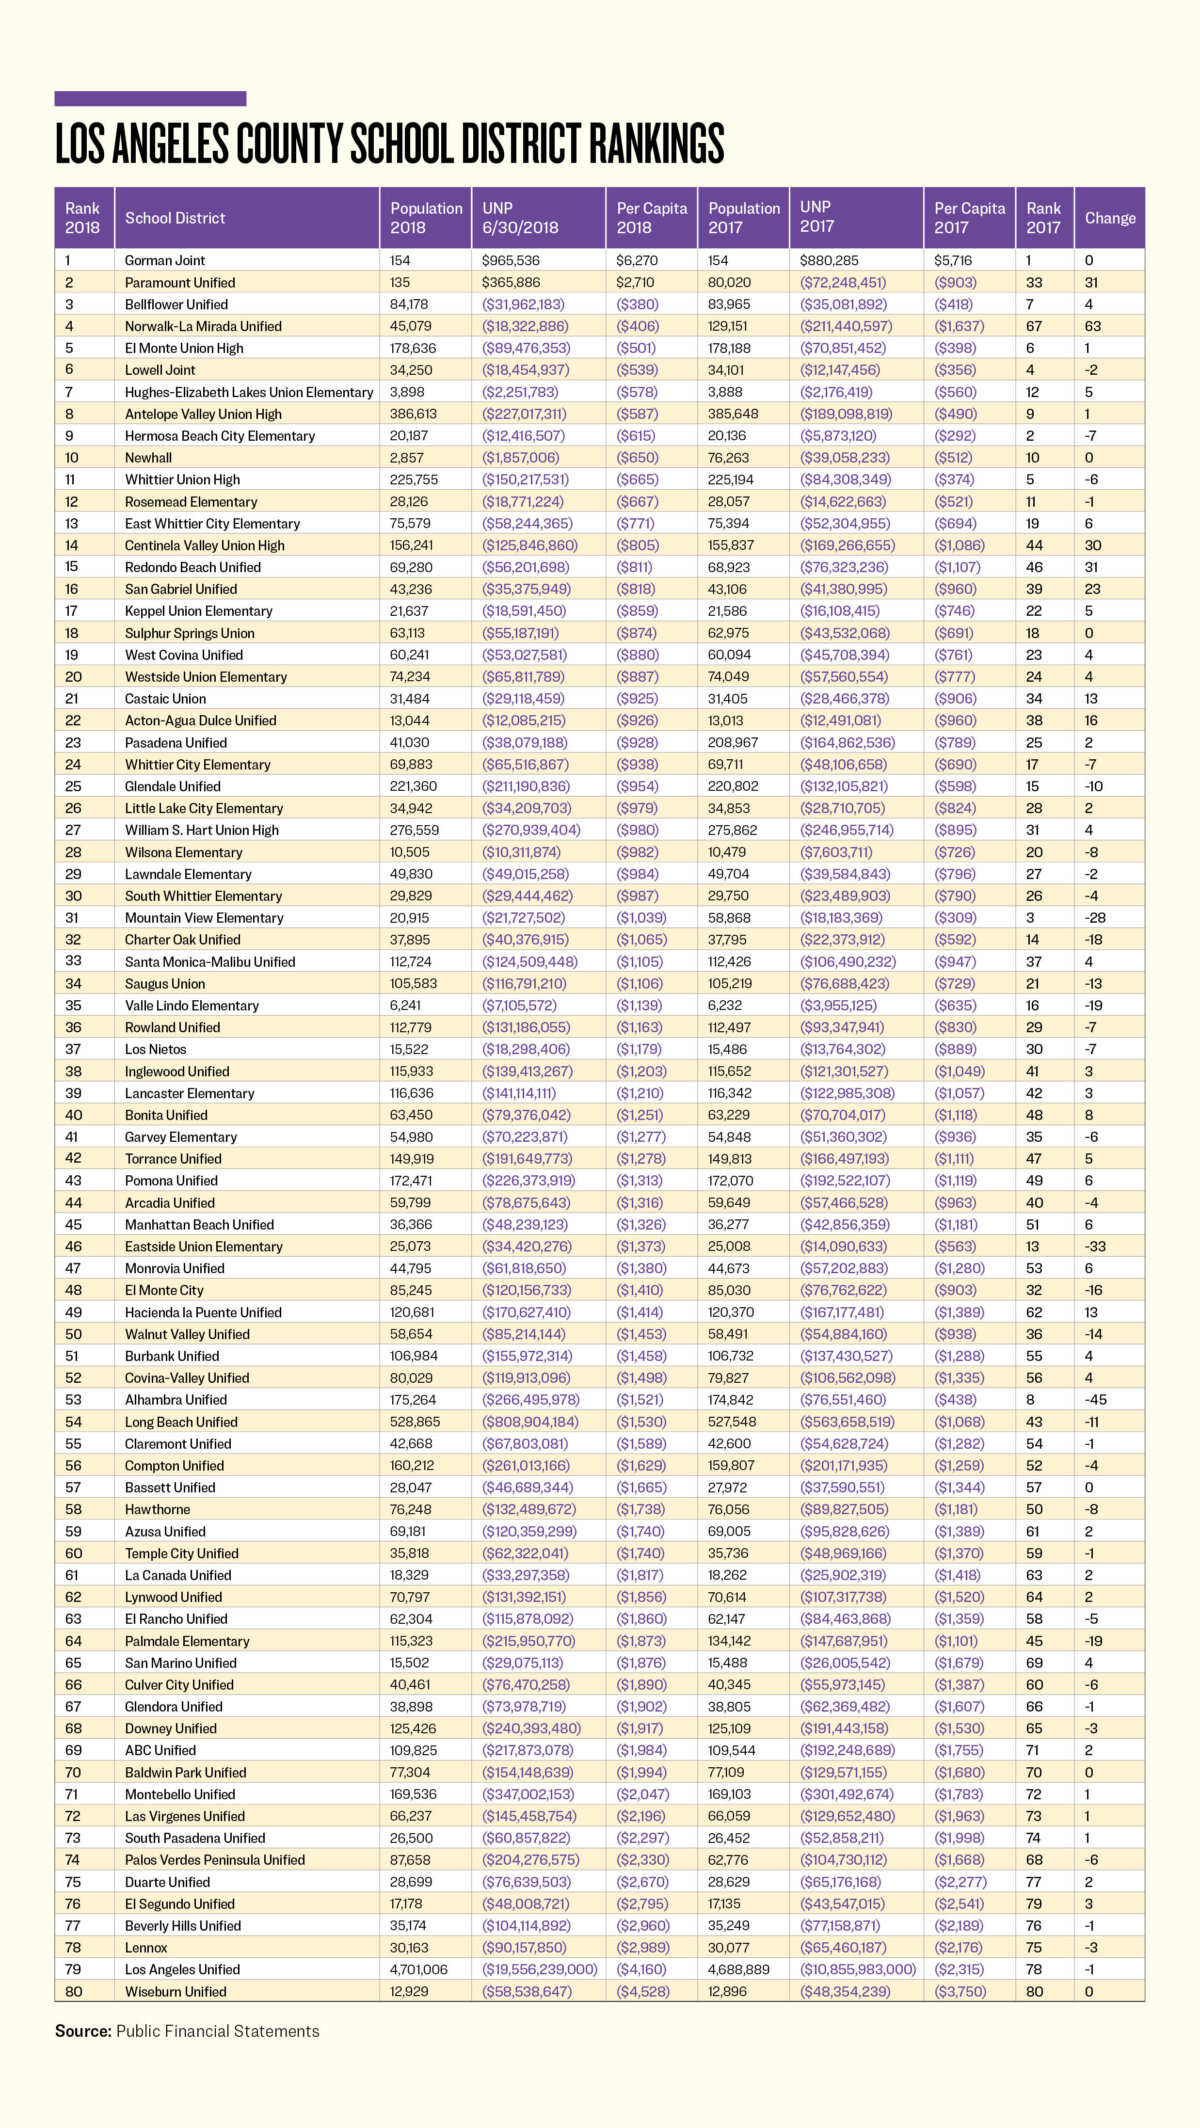
Businesses with negative retained earnings are usually bankruptcy candidates. But for school districts, the major driver for having a negative UNP, or unrestricted net deficit, is the liabilities (shortfall) for defined benefit pension plans which will provide the retirement benefits and also the retiree medical plans, that will provide, in many cases, lifetime medical benefits for retired teachers.
These unfunded promises are coming back to roost and will keep school districts burdened for decades. In the case of the Los Angeles Unified School District, its unrestricted net deficit grew by $8.7 billion. But it only dropped one position because it is at the bottom of the rankings.
As for the per capitas, most districts tend to stay at or near their normal positions in the annual rankings. The goal would be for each district to move up in the rankings. Let’s review those that moved up or down in a significant fashion during the year.
Seven school districts moved up 10 or more places. The biggest mover, Redondo Beach Unified School District, jumped up 32 places. A review of its audited financial statements finds an odd anomaly. The net investment in capital assets provided in the net position section dropped by $24.4 million, to a negative $2 million, while its unrestricted net deficit improved by $20.1 million. But wait. Having a negative net investment in capital assets can only occur if the underlying debt is larger than the actual cost of the assets, less depreciation. This makes the district’s story a unique one, in an odd way. That’s what having, what in essence is a negative mortgage, will do. Odd, indeed.
Centinela Valley Union High School District moved up 31 places, thanks to a reduction in its unrestricted net deficit of $43.4 million. Reducing the restricted assets by $65.7 million and investing a net of $25.6 million into capital assets provides the bulk of the explanation. With funds moving around for new assets and escrows, it also saw its Other Post-Employment Benefits (OPEB) liability grow by $28.7 million.
San Gabriel Unified School District moved up 24 places, with a story similar to that of Redondo Beach Unified. Its net investment in capital assets dropped by $23.6 million, thanks to an increase in general obligation bonds. A total of $10.6 million was moved into restricted assets, and expenditures in excess of revenues was $4.7 million. This explains the bulk of the $6 million net increase in its unrestricted net deficit.
Acton-Agua Dulce Unified School District moved up 17 places. After emailing the district’s assistant superintendent for business services, Khai Nguyen, I was able to obtain every year’s financial statement audits except for 2018. Residents within this district who wish to know the exact details will have to contact him.
Castaic Union School District moved up 14 places by standing still. So many districts moved down that this one, holding its ground, advanced. More on this later. Hacienda la Puente Unified School District moved up 14 places and Bonita Unified School District moved up 10 places, for similar reasons.
Now let’s look at the districts that had major downward movement.
Long Beach Unified School District moved down 10 places. Its unrestricted net deficit grew by $245 million. Note 15 to the audited financial statements provides the major reason:
“The beginning net position of the basic financial statements has been restated by a net reduction of $260,260,154 in the statement of activities to recognize the beginning balance of the OPEB liability resulting from the implementation of GASB No. 75, Accounting and Financial Reporting for Postemployment Benefits Other Than Pensions.”
Paramount Unified School District moved down 10 places. The OPEB restatement was $37.5 million, explaining the $33.4 million decrease in its unrestricted net position.
Saugus Union School District moved down 11 places. It too had a restatement for its OPEB liability of $34 million, explaining the bulk of why its unrestricted net deficit grew by $40 million.
El Monte City School District moved down 15 places. It also made a restatement for OPEBS of $36 million. Add to this the expenditures in excess of revenues of $5.9 million, and you have the bulk of the $43.4 million increase in its unrestricted net deficit.
Charter Oak Unified School District moved down 16 places. Its unrestricted net deficit grew by $18 million, mostly due to the OPEB restatement of $15.3 million.
Valle Lindo Elementary School District moved down 17 places. Its unrestricted net deficit grew by $1.1 million, thanks to an OPEB restatement of $2 million.
Palmdale Elementary School District moved down 26 places. It had expenditures in excess of revenues of $24.5 million and its OPEB liability grew by $104.4 million, explaining the $128.2 million increase in its unrestricted net deficit.
Eastside Union Elementary School District moved down 32 places. It had expenditures in excess of revenues of $4.6 million, an increase in pension liabilities of $6.6 million, a transfer of $5.7 million into restricted assets, and an increase of $6.6 million in the net investment in capital assets, explaining the overall increase in the unrestricted net deficit of $20.3 million.
Alhambra Unified School District moved down 44 places. It reported new OPEB liabilities of $131.2 million and new pension liabilities of $22.2 million. There was an increase in the net investment in capital assets of $65.4 million, but it was not reflected in the capital assets section of the balance sheet. With revenues in excess of expenditures of $13.9 million, the $190 million increase in the district’s unrestricted net deficit is explained.
School districts are dynamic municipalities, and each one has a story. Providing the financial information from those districts that post their audited financial statements will help tell a story of how the fiscal stress is being managed, giving you something to discuss should you have a chance to meet with your elected school board trustees.