

Commentary
A look at audited financial statements for the 80 school districts in Los Angeles County shows less movement in the rankings for the year ending June 30, 2019, compared to the previous year.
The Government Accounting Standards Board (GASB) had recently required the unfunded portion of promises to provide medical reimbursement plans for retirees, based on their actuarial costs, on the balance sheet as a liability, and municipal reporting started to reveal growing unrestricted net deficits (negative owner’s equity/retained earnings on for-profit financial statements) for school districts.
Known as Other Post-Employment Benefits (OPEB), reporting the unfunded actuarial accrued liability (UAAL) for retiree medical on the books was to occur in 2017. These obligations are now being reflected in the audited financial statements as a result of implementing GASB No. 75, “Accounting and Financial Reporting for Postemployment Benefits Other Than Pensions.”
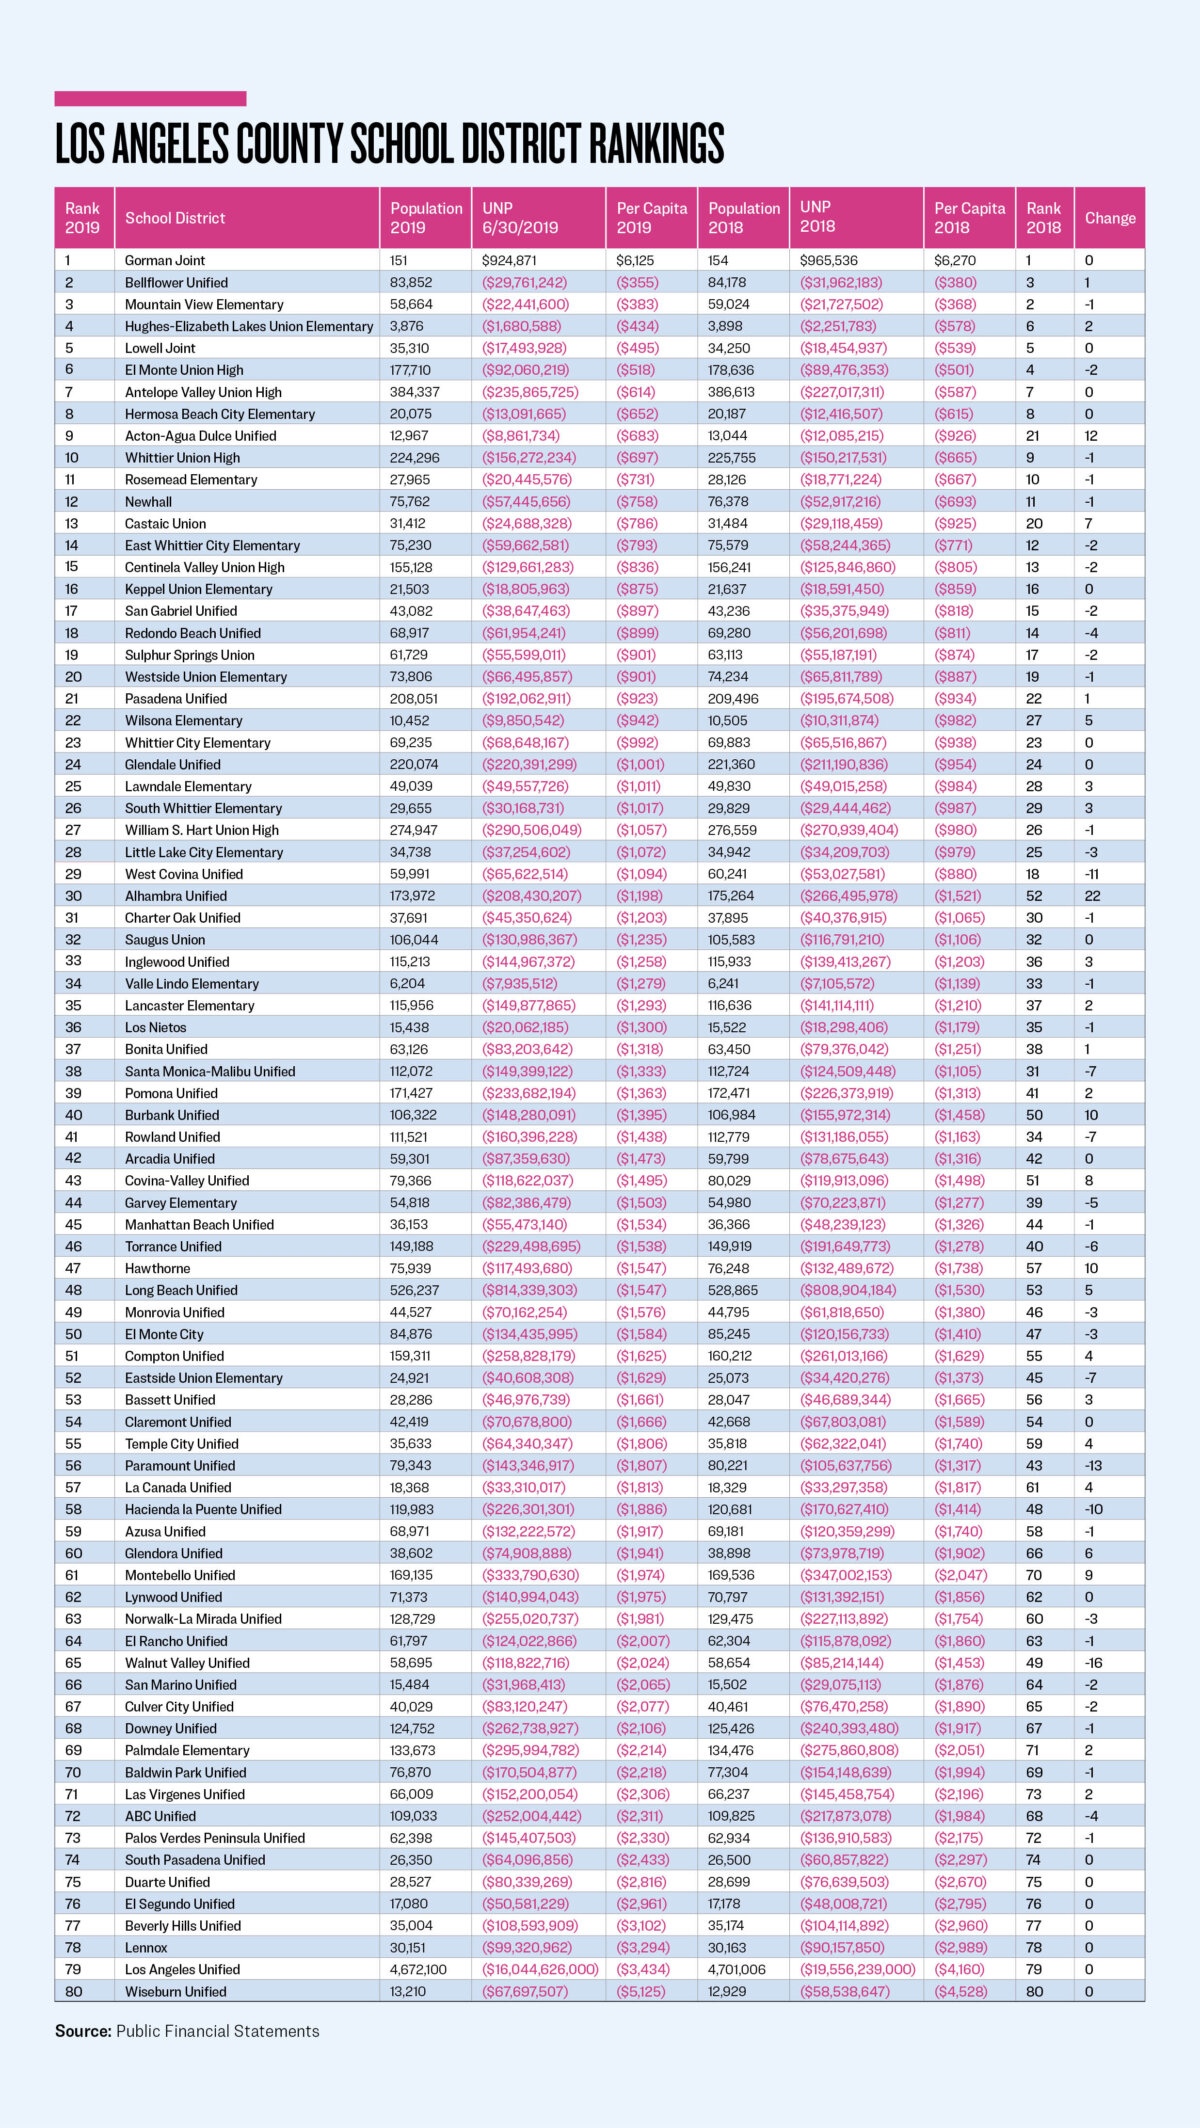
The graph below provides the 80 districts, the populations they serve, and their unrestricted net positions (UNP) for 2018 and 2019. It’s calculated by taking assets and subtracting liabilities—and the result should be zero or better. Dividing the population into the UNP provides a temperature gauge on the fiscal strength of each district.
The rankings for 2019 show 70 school districts moving eight or fewer places. Only 17 districts moved more than five places, so let’s review the top five that moved up and down.
Alhambra Unified moved up 22 places, rebounding from its 44-place drop in 2018. The district borrowed $55 million by issuing bonds for capital investments, related to a ballot measure passed in 2016, but only spent $10.1 million during the year. The net amount offset the increases to the unrestricted net deficit caused by a transfer to restricted assets of $14.1 million and expenditures in excess of revenues for the year of $8.5 million.
Combined, it explains the bulk of how the unrestricted net deficit was reduced by $18.6 million. Also, the unfunded liabilities for the pension and retiree medical plans increased by a net of $11.6 million.
Acton-Agua Dulce Unified moved up 12 places, continuing its aggressive upward pace from the previous year (17 places). Having $2.3 million in revenues in excess of expenditures and a reduction of $0.9 million in restricted assets explains the improvement of $3.2 million in its unrestricted net deficit.
Burbank Unified moved up 10 places. It had expenditures in excess of revenues of $17.5 million, but transferred $20.8 million out of restricted assets and reduced its net investment in capital assets by $4.4 million (but how and why is not clear from the notes accompanying the financial statement). The net result was an improvement to its unrestricted net deficit of $7.7 million. But the net pension and OPEB liabilities increased by $17.6 million. Keep an eye on this district’s balance sheet over the coming years.
Hawthorne moved up 10 places. It incurred $33.7 million in general obligation bond debt, with $13.7 million secured by the district’s investment in capital assets. Add to this its revenues in excess of expenditures of $3.2 million and it explains the bulk of the $15 million reduction in the district’s unrestricted net deficit.
Montebello Unified moved up 9 places, thanks to revenues in excess of expenditures of $28.8 million. This helped to reduce its unrestricted net deficit by $13.2 million.
Walnut Valley Unified dropped 16 places. It moved $7.7 million into restricted assets. It also increased its net investment in capital assets by $26.3 million. This explains the increase in its unrestricted net deficit of $33.6 million. But the capital assets and long-term obligations had minimal movement and the disclosures provide no explanation for the increase to the $26.3 million mystery amount.
Paramount Unified dropped 13 places, continuing its declining pace from 2018. It has a similar story to that of Walnut Valley. It increased its net investment in capital assets by $33 million, but did not increase its capital assets or reduce its debt secured by those capital assets. It increased its general obligation bonds by $30 million, its OPEB liabilities by $10.2 million, and its pension liabilities by $5.9 million. There’s a lot of movement, and trying to explain the increase of $37.7 million in its unrestricted net deficit can only be done with a mystery amount. This may be my way of saying that things just may be worse than how the picture is being presented. Voters in this district should be watchful.
Hacienda la Puente Unified dropped 10 places. A simple answer for the $40 million increase in its unrestricted net deficit is the transfer of $41.2 million into restricted assets. But that would leave out revenues in excess of expenditures of $25.3 million that were offset by a restatement of the pension liabilities of $15.6 million and $10.9 million spent on construction in progress.
West Covina Unified dropped 11 places. It had expenditures in excess of revenues of $5.5 million which was offset by $4.6 million in a reduction of restricted assets. With a net investment in capital assets of $11.7, the unrestricted net deficit grew by $12.6 million.
The implementation of modifications to the financial statements of the county’s school districts, providing the previously unreported unfunded liabilities (actuarially assumed expenditures less funds set aside to pay the future benefits), should calm the rankings.
Now it’s up to each district to live within its budgets and reduce these liabilities. There will always be challenges. For the next fiscal year ending June 30, 2020, it will cover the COVID-19 lockdown.