Commentary
In the Bay Area, in Caltrans District 4, there are 101 cities. Each one prepares and provides an annual comprehensive financial report (ACFR) for its constituents. Regretfully, not all of them are issued in a timely manner.
The cities of Portola Valley and Sonoma recently issued their ACFRs for the year ending on June 30, 2021. This is the time of year when their ACFRs for the fiscal year (FY) ending June 30, 2024, should be made available. Sonoma’s outside independent auditors completed their fieldwork on Aug. 12, 2024. Portola Valley’s fieldwork was completed on April 15, 2024, but the city council finally approved it for posting on Nov. 25.
Waiting more than three years is a sad testimony to the priority placed on this required transparency chore by the members of their city councils and management. The COVID-19 lockdown made this a very difficult year, but delaying financial reporting this long cannot be a result of this unique occurrence. It even caused the residents of this town some national embarrassment when The Wall Street Journal recently took their city hall to task over its finances.
Tony McFarland, Portola Valley’s new finance director, recently provided the following in a written statement: “There are various reasons for the delay, but the most glaring has been the inability to recruit and retain finance staff. The current finance staffing level is 4 [full-time workers]. We are currently undertaking an aggressive audit schedule that will complete audits for FY 21-22, FY 22-23, FY 23-24, and FY 24-25 by September 2025.”
The good news is that these cities can now be accurately ranked based on the actual audited financial statements by independent Certified Public Accounting firms. And there is a good possibility of getting them up to current status in the next few months.
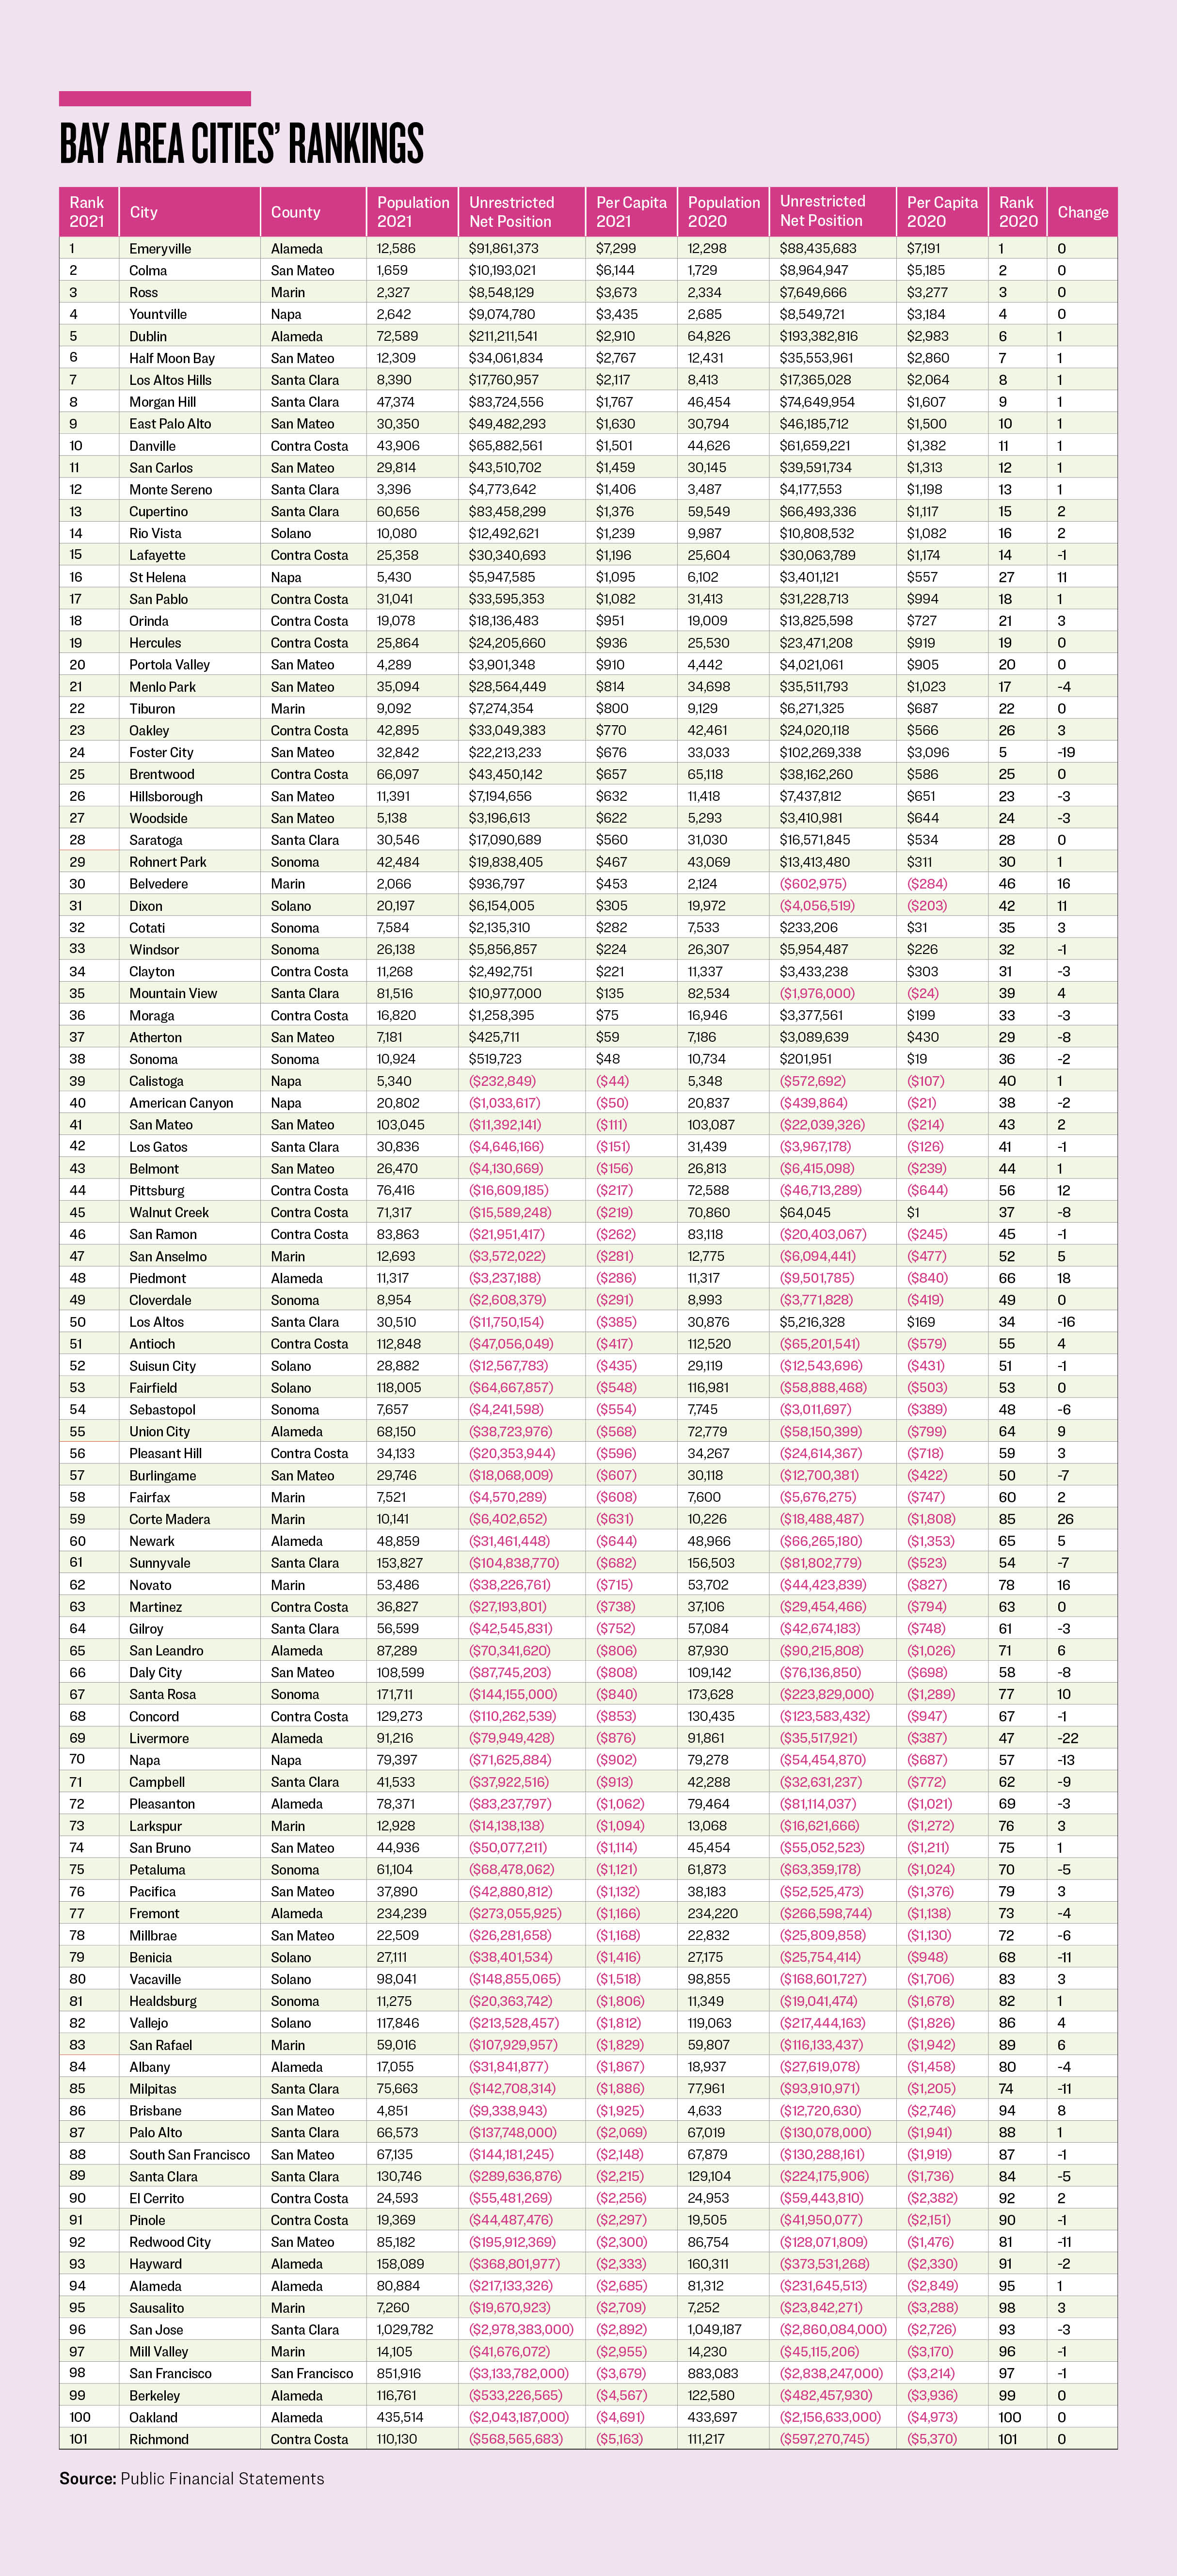
The ranking is very simple. Go to the city’s basic financial statements and find the statement of net position. Taking the unrestricted net assets for governmental activities and dividing it by the city’s population provides a per capita amount. It is a helpful gauge to determine the fiscal viability of a city.
The city of Oakland has garnered plenty of negative news of late and even saw a recall of its mayor a few weeks ago. It should be of no surprise that they rank 100th out of 101 cities, and thank the city of Richmond that it is not in last place.
As the newest annual ACFRs for these cities become available, it will be important to note if cities like Oakland are improving, maintaining, or getting more insolvent.
As can be seen by the graph below, more than a third of the cities are in positive territory. Those with unrestricted net deficits will have a higher level of difficulty weathering a recession. During a recession, revenues decline and investments in the California Public Employees’ Retirement System (CalPERS) produce negative rates of return, resulting in increasing contribution amounts. It’s the type of vice-grip that city managers want to avoid.
There are fifteen cities that moved up or down by double digits. And fifteen cities maintained their places in the rankings and didn’t move at all. One-quarter, 26, only moved one place. While one-third, 34, moved two to five positions and 11 moved six to nine places. Let’s review the big movers in the order they appear on the chart.
The city of St. Helena had revenues in excess of expenditures of $2.8 million, increasing its unrestricted net position by $2.5 million, and moving the city up 11 places.
The small city of Belvedere enjoyed a second year of revenues in excess of expenditures, with $1.85 million in 2021, improving its unrestricted net position by $1.5 million, and advancing 16 places.
The city of Dixon had revenues in excess of expenditures of $8.8 million and increased its restricted assets by $748,000, explaining the majority of its unrestricted net position improvement of $10.2 million. It moved up 11 positions.
The city of Pittsburg only had revenues in excess of expenditures of $9.5 million, but reduced its unrestricted net deficit by $30 million. Reducing its restricted assets by $14.9 million explains half of it. The receipt of unearned income, reflected as a liability of $10.5 million, explains the bulk of the remainder. It moved up 18 places.
The city of Piedmont had revenues in excess of expenditures of $7.4 million, allowing its unrestricted net deficit to be reduced by $6.3 million, and also moving it up 18 positions.
The city of Corte Madera made the biggest upward move of the year, jumping up 26 places. It reduced its unrestricted net deficit by nearly two-thirds, $12 million. Revenues exceeding expenditures by $7.8 million helped. Reducing restricted funds contributed another $1.9 million. Building a new town hall, with spending $5.6 million and new borrowings of $6.9 million, explains the reduction in the investment in capital assets of $2.4 million, when depreciation is taken into consideration. The reverberations from borrowing nearly $19 million through pension obligation bonds is yet to be seen.
The city of Novato had revenues in excess of expenditures of $6.4 million, which should have explained its $6.2 million improvement to its unrestricted net position. But it saw a prior period adjustment of $5.2 million, which was offset by a reduction in capital assets of $4 million. The small decrease in its unrestricted net deficit moved it up 16 places.
The city of Santa Rosa had $88.5 million in revenues in excess of expenditures, thanks mainly to the $95.5 million settlement from PG&E resulting from a lawsuit from the Tubbs fire that occurred in 2017. This explains the decrease in the city’s unrestricted net deficit of $80 million and why it moved up 10 places.
Foster City had revenues in excess of expenditures of $7.8 million, but its unrestricted net position dropped by $80 million. The city borrowed $85 million for a levee improvement project, with $27 million being spent during the fiscal year, and increased its restricted assets by $60.8 million. This caused it to drop 19 places.
The city of Los Altos had revenues in excess of expenditures of $9.2 million but saw its unrestricted net position decrease by $17 million. This $26.2 million swing occurred because $8.6 million was moved into restricted assets, a net $21.1 million was spent on capital assets, with $10 million in related borrowings, and pension liabilities grew by $3.1 million. Los Altos dropped 16 positions.
The city of Livermore had the largest drop, 22 places, increasing its unrestricted net deficit by $44.4 million. It had $10 million in revenues over expenditures. But it moved $57.4 million into restricted assets, with $50 million of it allocated for affordable housing.
The city of Napa had expenditures in excess of revenues of $12.7 million, explaining the majority of the $17 million increase in its unrestricted net deficit. It also moved $18.4 million into restricted assets with an offset resulting from the reduction of its net investment in capital assets by $13.9 million, with the cancellation of a civic center project explaining the rest. It dropped 13 places.
Home to one of California’s original state capitols, Benecia had $5.4 million in expenditures in excess of revenues. Along with an increase in its pension liabilities of $5.8 million, this explains the bulk of the $12.6 million increase in the city’s unrestricted net deficit and its dropping 11 places.
The city of Milpitas also dropped 11 places. It had expenditures in excess of revenues of $4.5 million, moved $30.3 million into restricted assets, and an increase in the net investment of capital assets of $13.9 million explains the increase in unrestricted net deficit of $48.7 million.
Finally, Redwood City also dropped 11 places during the year, even with $41.6 million in revenues in excess of expenditures. Moving $99.8 million into restricted assets explains the bulk of the $67.8 million increase in its unrestricted net deficit. The remainder comes from the net borrowing and construction activities related to a veterans memorial and senior center building.
Condensing hundreds of pages from the annual comprehensive financial reports into two and three sentence paragraphs is not for the faint of heart and is time consuming. But, reviewing the ACFR for the city where you own your home would be a wise investment of time, as your residence may be your most valuable asset. To assist in your studies, the 2020 rankings can be found at “Which Bay Area Cities Need to Improve Their Fiscal Status?” from March 6.
How some cities can conduct their business and approve their budgets without current financial statements is reckless. Regretfully, this is how the state of California operates. So how can we be upset with laggard cities? Here’s to encouraging Portola Valley and Sonoma in releasing their 2022 ACFRs soon.


