
The United States has nearly 50 percent more home sellers than home buyers, a new analysis suggests, a shift that could put downward pressure on prices even as high mortgage rates continue to strain affordability.
New estimates published by Redfin on March 23 found that, as of February 2026, there were 630,000 more people selling homes than buying them. That is the largest gap the online real estate brokerage has recorded since it began tracking the data in 2013.
Redfin said the seller-to-buyer ratio climbed to 46.3 percent in February, marking a record high. The ratio rose to about 30 percent at the start of the COVID-19 pandemic, then swung to roughly minus 30 percent in 2021 as buyers vastly outnumbered sellers. It has since reversed course, returning to early COVID-19 pandemic levels in spring 2025 before surging to a new peak this year.
Redfin defines a buyer’s market as one in which sellers outnumber buyers by at least 10 percent, and a seller’s market as one in which sellers are at least 10 percent fewer than buyers. By that definition, the U.S. housing market has been in buyer’s-market territory since May 2024.
A shift from a seller’s market to a buyer’s market typically gives buyers more leverage, as sellers must compete harder for a smaller pool of purchasers. That generally means more choices, more room to negotiate, and less pressure to make quick decisions.
Other housing data point in the same direction. Realtor.com reported that the typical home spent 78 days on the market in January, five days longer than a year earlier, marking the 22nd consecutive month in which homes took longer to sell on a year-over-year basis.
Elevated new-home inventory is another sign that the market is tilting toward buyers. According to the latest U.S. Census Bureau data, the supply of new homes for sale rose to 9.7 months in January 2026, meaning that it would take that long to clear existing inventory at the current sales pace.
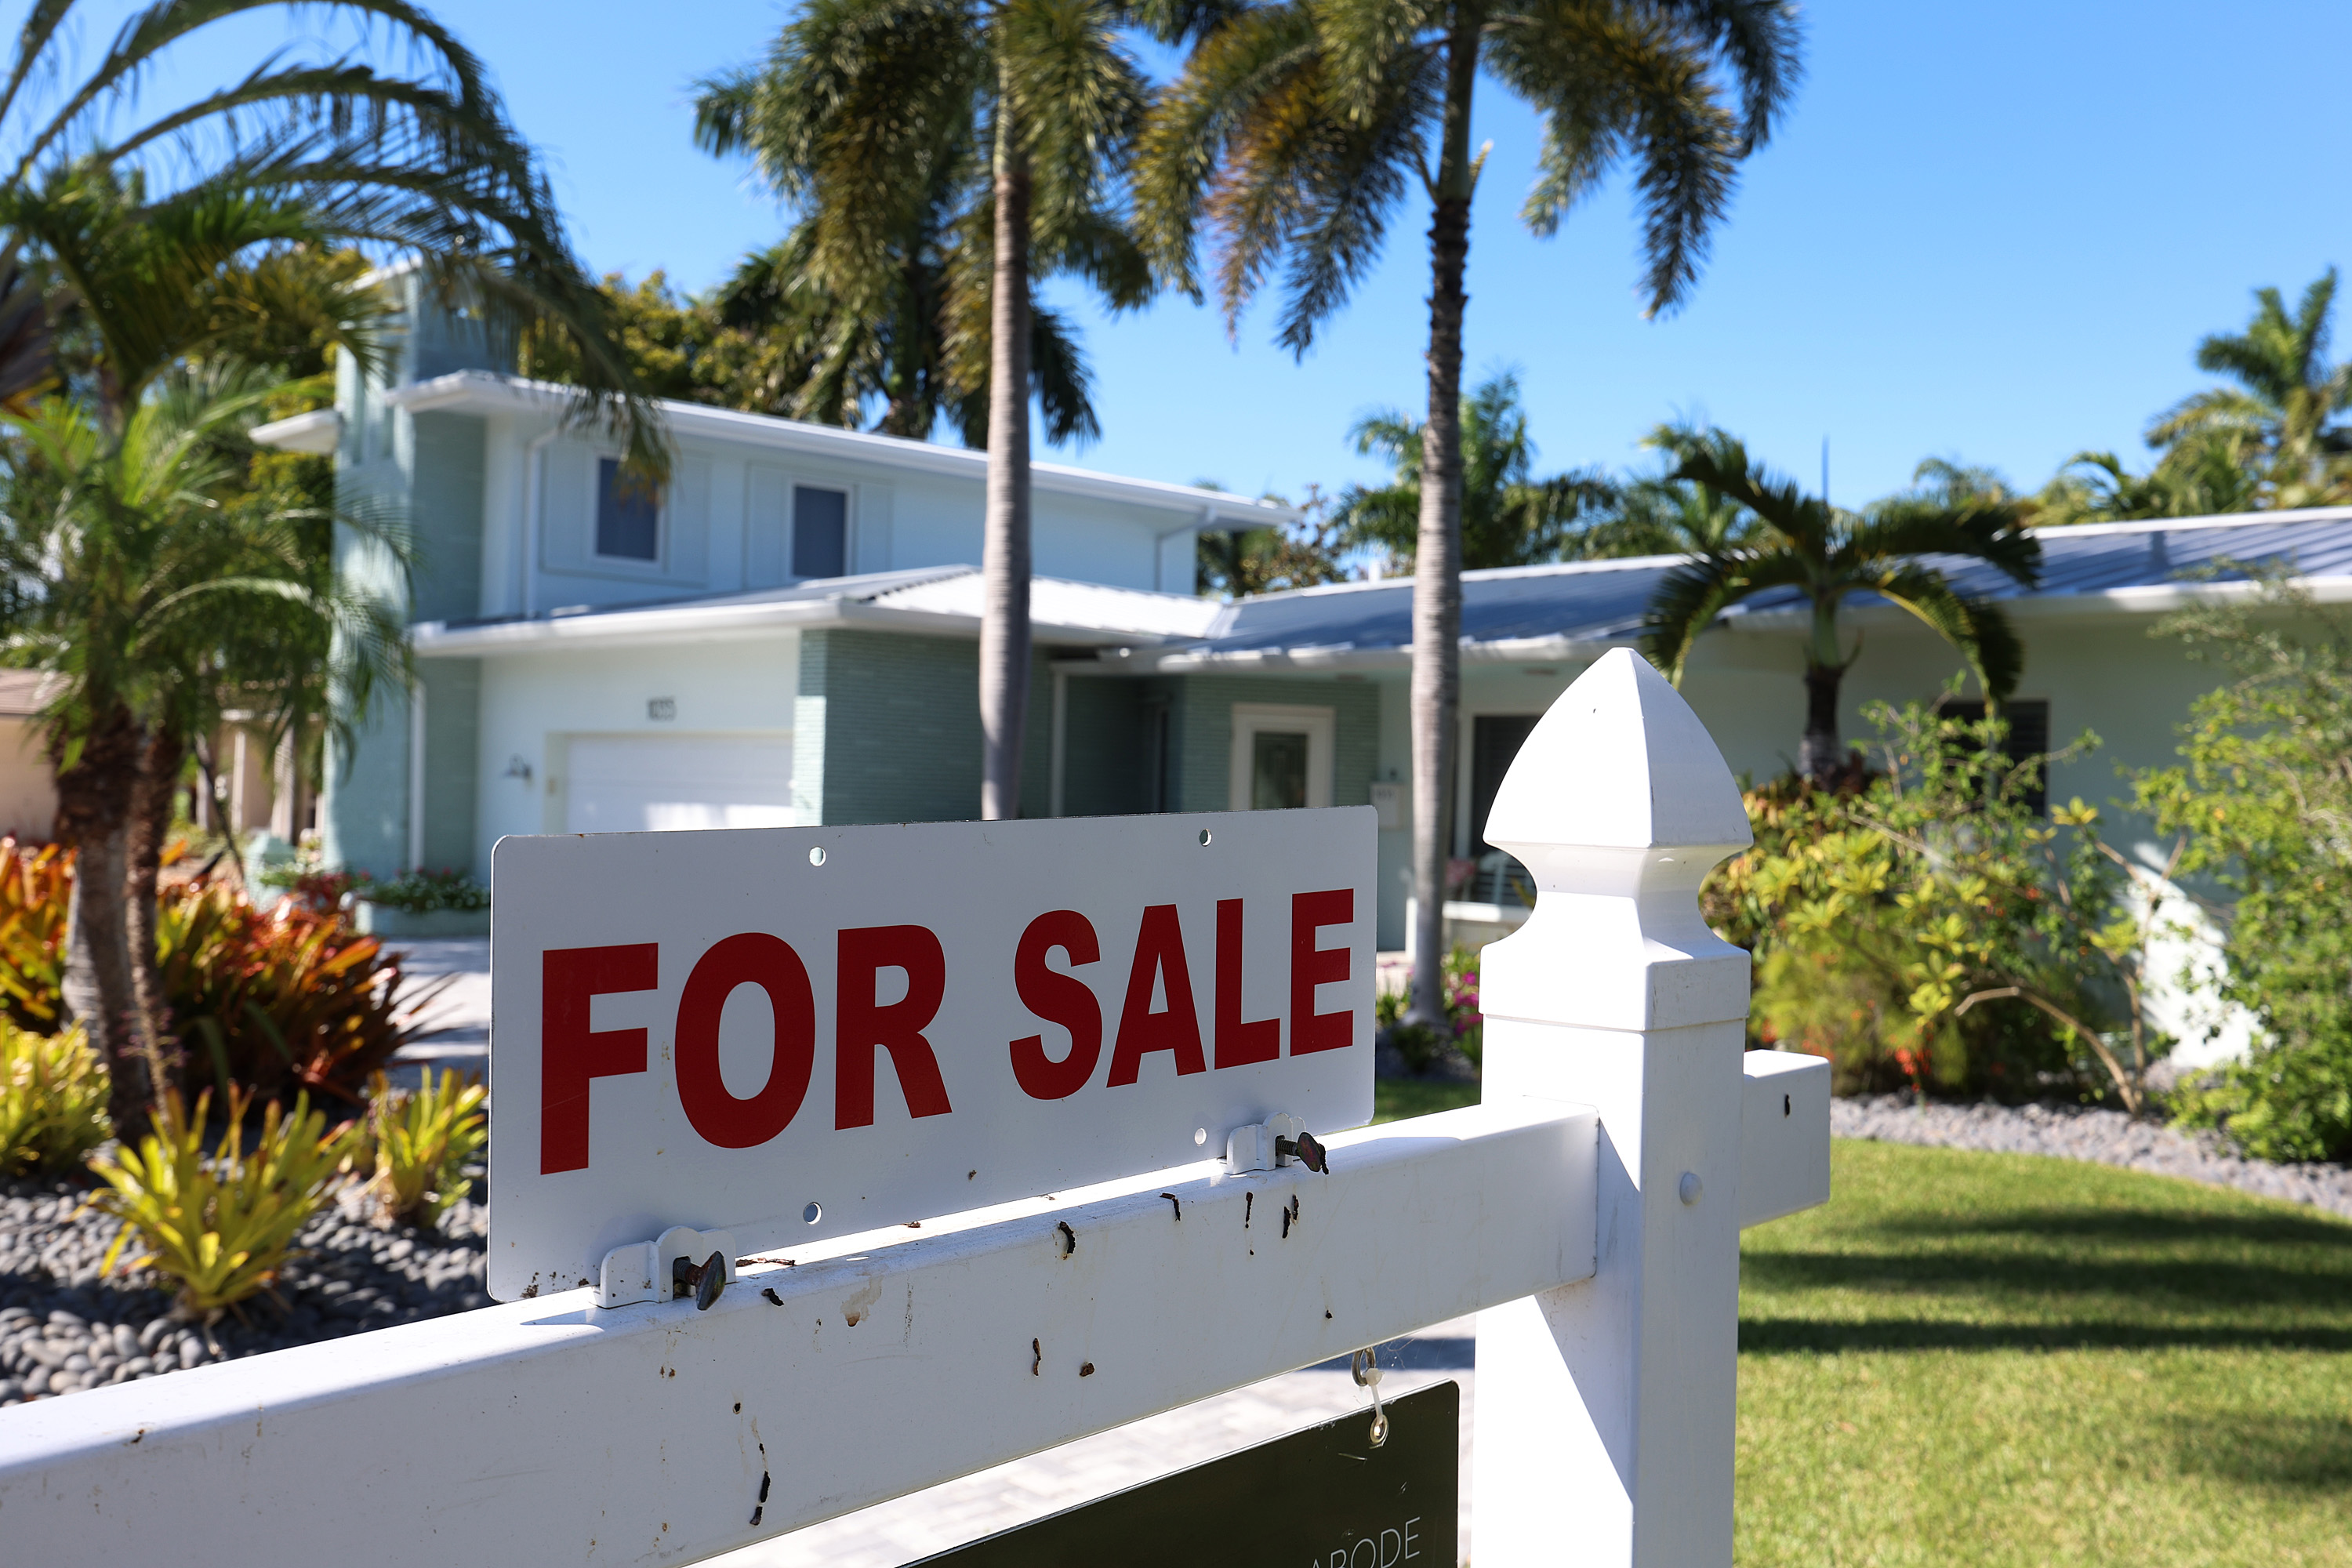
Still, the market can look very different depending on location. According to Redfin, the strongest buyer’s markets in February were concentrated in the Sun Belt, led by Miami, where sellers outnumbered buyers by 163 percent. Nashville followed at 120 percent; then Austin, Texas, at 112 percent; West Palm Beach, Florida, at 110 percent; and San Antonio at 104 percent.
The strongest seller’s market, by contrast, was Newark, New Jersey, where Redfin estimated there were 31.1 percent fewer sellers than buyers. The other four seller’s markets were Montgomery County, Pennsylvania; Nassau County, New York; Milwaukee; and New Brunswick, New Jersey.
The swing toward a buyer’s market comes as demand continues to soften. Federal data show that sales of newly built single-family homes fell by 17.6 percent in January to a seasonally adjusted annual rate of 587,000, the lowest level since October 2022. Sales of existing homes also dropped by 1.4 percent from the prior month in February, according to the National Association of Realtors.
Redfin estimated that the number of homebuyers in the market fell by 2.4 percent month over month in February, to 1.36 million, while the number of sellers slipped by a smaller 0.4 percent, to 1.99 million. It said many buyers are pulling back because of high home prices, mortgage rates, layoffs, and broader economic and political uncertainty.
Home prices have not fallen sharply at the national level. An analysis by Homes.com found that the national median home price in February was $375,885, up by just 0.2 percent from a year earlier and by 0.4 percent from January, suggesting that price growth has largely stalled rather than reversed.
Mortgage rates, which dipped below 6 percent in late February, have marched higher since the United States’ and Israel’s war with Iran sent global oil prices soaring. Freddie Mac said the average rate on a 30-year fixed mortgage was 6.22 percent as of March 19, up from 6.11 percent a week earlier.